Candlestick Patterns - Steemit Crypto Academy Season 5 - Homework Post for Task 10


a) Explain the Japanese candlestick chart? (Original screenshot required).
b) In your own words, explain why the Japanese Candlestick chart is the most used in the financial market.
c) Describe a bullish and a bearish candle. Also, explain its anatomy. (Original screenshot required)
Explain the Japanese candlestick chart? (Original screenshot required).
The origin of the Japanese Candlestick Chart is in Japan. Rice traders used it and it was very successful in the stock market. This Japanese Candlestick Chart provides detailed information about the market. this chart is used to plot the prices with volumes. It can be read, analyzed, predicted. Reading and understanding candlestick patterns is generally called TA (Technical Analysis).
Japanese Candlestick is one kind of price chart used in technical analysis that shows us the high, low, open, and closing prices of an asset for a specific time period. It is made using the open, high, low, and close of a certain time period. It can be used for any time period, whether it can be one day, one hour, 5mins, or whatever you want. They are used to describe the price for a certain time period.
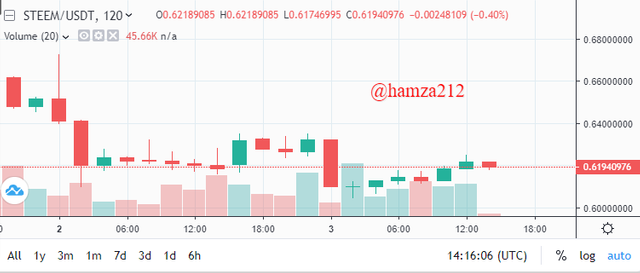
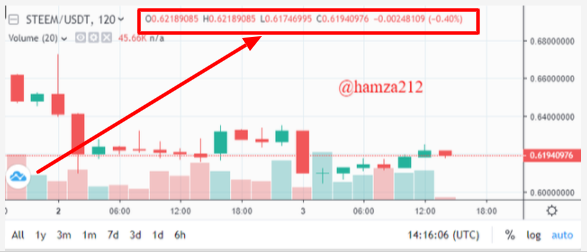
As we can see in the graph, each candle shows a defined time period of 5 minutes. This candle gives us detailed information about the price movement in these 5 minutes. We can see the opening price, minimum price, maximum price, and closing price in each candle. When pointers are placed on them, here I show you what these values of a candle look like.
This type of graph allows us to give a simple explanation of price movements, in which we can see the formation of both bullish and bearish trends, for this, we have the tools to identify these trends. Determining what will happen with the price and knowing when is the right time to buy or sell.
With the help of this type of graph, we can study a lot of market movements, for example, the usage I know the most is with cryptocurrencies, this kind of graph allows us to access a large number of pairs before our analysis before making our investments.
In your own words, explain why the Japanese Candlestick chart is the most used in the financial market.
I think the great acceptance of this type of chart in the financial market is related to the great ease with which it presents us so that a beginner trader can explain a good entry point in a position and an experienced trader can develop buying and selling and thus your Make the most of your experience to get a return on investment.
Also, the information given individually, 1 candle, as well as many of them together, can reflect the market sentiment and signal for the traders after the correct identification of the various patterns created in the market.
Similarly, these signals from patterns can complement technical indicators in a very effective way. In addition, confirming patterns and supplements and signals emitted by indicators are attempts to run activities that generate profit, while always minimizing the risks present while operating. By the way, for all these aspects I think the Japanese candlestick chart is the most used and personally, it has given me very good results by applying all the aspects mentioned above.
These indicators, such as the chart itself, can be customized to create an analysis strategy based on each individual's experience. You can decide to trade just by looking at the price movement. In other charts, it is practically impossible.
Describe a bullish and bearish candle. Also, explain its anatomy. (Original screenshot required)
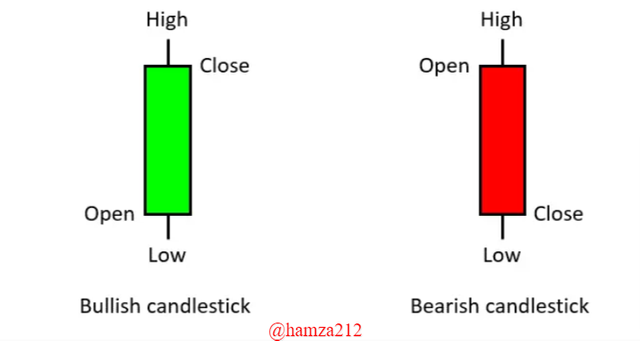
Japanese candles can be introduced in different varieties. We can find bullish or bearish Japanese candles with or without top shade, with a long or a short body. We can also find bullish or bearish doses. Below I will present two examples, a bullish candle, and a bearish candle. They show us the information about open, closed, high, and low prices. The order varies depending on whether it is bullish or bearish.
Bullish Japanese Candle
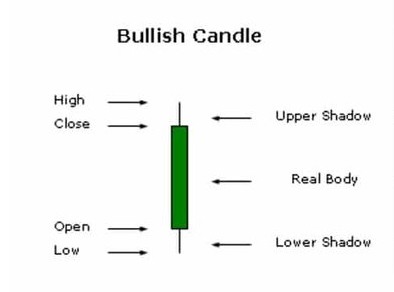
A bullish Japanese candle indicates the price of assets from the time it is opened until the time it is closed. The greater the difference between the two, the longer the final part of the candle will be. It is usually green and its full anatomy is presented as below.
Low: Low part of a bullish Japanese candle represents a lamp that indicates the difference between the opening price and the price that falls below.
Body: Body is the price that increases from opening to closing.
High: High indicates the difference between the maximum price of a candle and its closing price.
Bearish Japanese Candle
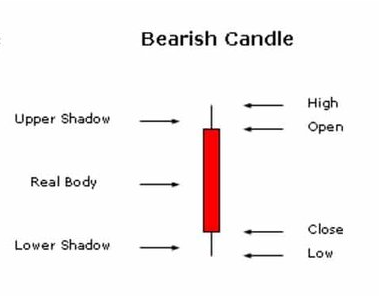
A bearish Japanese candle represents the decrease in price. This decrease is represented from the opening of the candle to the closing. We can see an example of this in the picture and its entire anatomy is below.
High: This upper shade or lamp consists of a combination of opening price and maximum price reached by a candle.
Body: The real body of the candle represents the price drop from the opening to the closing of the candle, this candle will get bigger as it decreases.
Low: This is the minimum difference reached between the price of a candle and the closing of a candle. As a body, the greater the difference between these two values, the bigger this wick will be.
Conclusion
This Japanese candlestick chart is one of the most used technical tool which is used by traders, merchants and investors around the world. This is because of its easy interpretation and the formation of patterns.
So many thanks to Sir @reminiscence for this lecture.