Trading Using Rectangular Pattern - Steemit Crypto Academy - S5W4 - Homework Post for @sachin08
Greetings,
it's my pleasure that I am a part of this wonderful community which gives me the opportunity to improve my knowledge in the crypto world. so, yet again this is season 5 of week 4. I am Hammad Aslam. my user name is @hammadahmed112. first, I am very thankful to the newly appointed prof. @sachin08. which gives a knowledgeable lecture to all of us. so, without any further delay let's move forward:

Edit on CANVA!

1. Explain Rectangle Pattern in your own word.
The Crypto market is full of opportunities like we see every day new projects come into the market and get the boom. but despite many advantages, it has also many disadvantages. like these days crypto is the favorite or hot topic to everyone. people think that we are rich in one night after investing a small amount. most of the newbie traders cannot do the analysis on their trade. they invest their money and face losses. as we all know that the crypto market is high volatility.
so, the first thing is analysis before taking the trades. there are two types of analysis in trading one is fundamental analysis and the second is technical analysis. so, today, we will be focusing on the technical analysis, and the one or most important technical analysis is Rectangle Pattern.
so, as we all know that is the shape of a rectangle has equal sides. there are four sides of the rectangle one horizontal side is on top and another is on the bottom. these sides like bottom and top which I mention above is the price level of the market.
as I previously mentioned the rectangle has four equal sides. the horizontal line on the top mentions the resistance level while on the other hand, the bottom line mentions the support level.
the formation of the rectangle pattern helps the investor that what is the next trend is going on. either it is bull run or bear run. rectangle pattern shows there is no tend if the price move to bull or bear between the support and resistance levels. if there is any breakout that occurs so, it means the pattern is ended.
2. How to identify Rectangle. Explain with Screenshots.
identification of the Rectangle pattern is very simple. so, there are two ways to identify the rectangle pattern one is price trend and another one is the horizontal trend lines. these two lines we can say that it is the backbone of the rectangle pattern. let's discuss one by one both of these:
1.Price Trend:
the word trend is referred to something is begins from low to high. this low to high movement is a trend. so, the price trend is when the price of any token goes into the specified direction like from bullish to bearish. so, what is the bullish movement it is? when the price of any token starts from low and makes the new higher highs in the market. the same scenario is applied on the bearish market when the price of any token goes down after making the higher highs. so, in both scenarios, to identify the rectangle pattern so, you need to focus on the disappearance of both of these trends means the sideways movement.
2. Horizontal Trendline:
the second key point of identification of rectangle pattern is Horizontal pattern. as you guys see in the chart of the above image so, see the two trend lines. the top line shows the resistance level of the pattern while the bottom line shows the support level. the one thing which is very important is if the price hits these the bottom line more than three times. so, it means that the price falls from the bottom and then again rises.
3. Can we use indicators with this pattern to get accurate results? Explain with screenshots.
yes, even it is very important or recommended to use the indicator with the pattern. the reason why I am saying it is important. it is some times a false or fake pattern is generated in the market. so, in this scenario, we can not identify what is the next trend is going on.
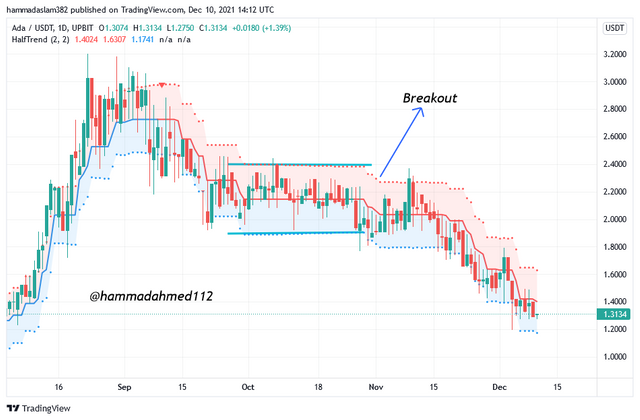
the above image which you will see it is the chart of ADA/USDT. first I will draw the rectangle pattern and also draw the breakout after that I apply the indicator on it the indicator which you will see is the Half trend. to confirm the pattern either is correct or not we can apply the indicator to it. after applying the indicator I will notice that the pattern is correct it goes down towards the bearish market.
4. Explain Rectangle Tops and Rectangle Bottoms in your own words with screenshots of both patterns.
Rectangle Top: is appeared the bullish movement of price. as I previously mentions that the top line is the resistance level. if the price breaks this line. so, it means the bull run is started. let's see the chart:
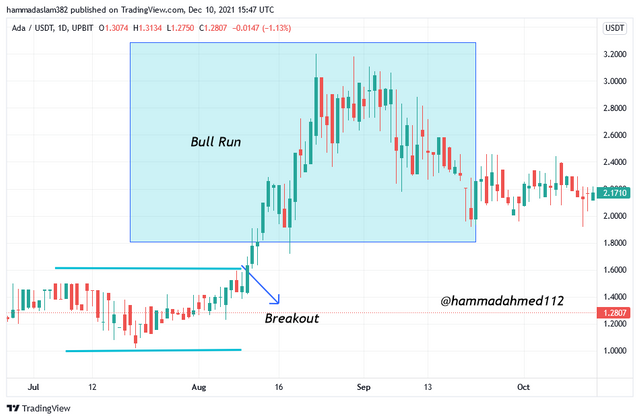
In the above screenshot, you have clearly seen the top of the rectangle line breaks, and the bull run starts. this bull run is for a long time. so, here is a key point which is if the rectangle top is broken so, it means the bullish market is starting
Rectangle Bottom: Likewise, the rectangle bottom is usually created after a bullish price movement. this indicates that in order to identify a rectangle bottom pattern, first must spot a downtrend movement in the chart. see the image for clear identification:
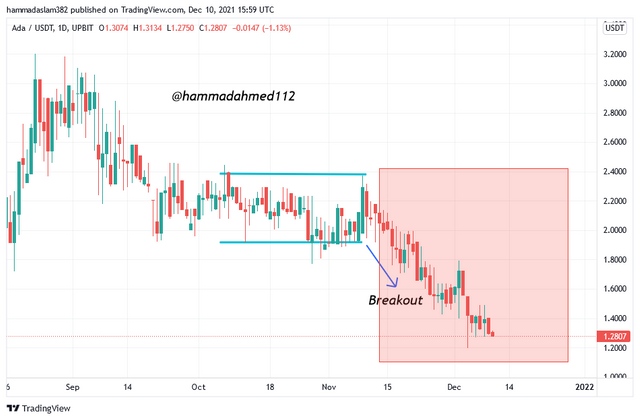
As you can see in the screenshot above, a long bearish trend movement has taken before the rectangle bottom is formed. As I previously stated, this is dependent on the type of trend that has happened.
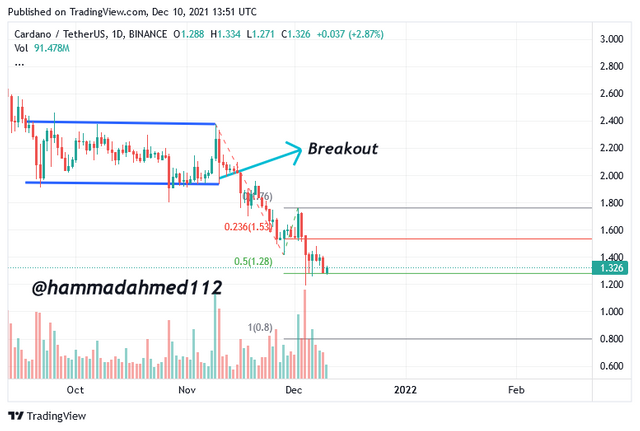
5. Show full trade setup using this pattern for both trends. (Entry point, Take profit, Stop loss and breakout)
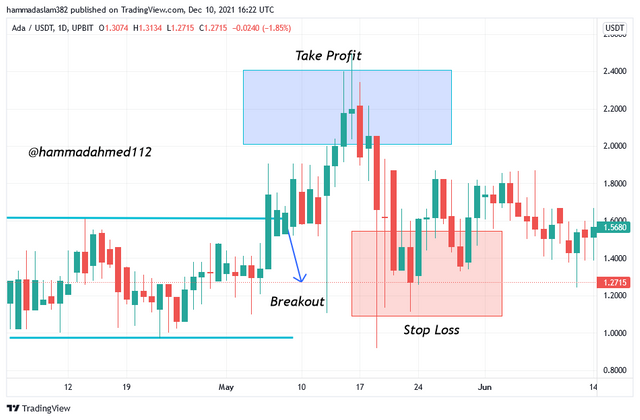
Buy Trade Setup:
In the above screenshot, I will select the Cardano in usdt pair. first I have to identify the entry-level, breakpoint and stop loss and label it on the chart. from the chart, the top of the horizontal line breaks and the bull run to start. this bull run is the profit area we have to wait for a time and see what the next movement of price is. if the price goes down so, we sell our trade before the loss. and at last, the stop loss is for the last target area before leaving the market.
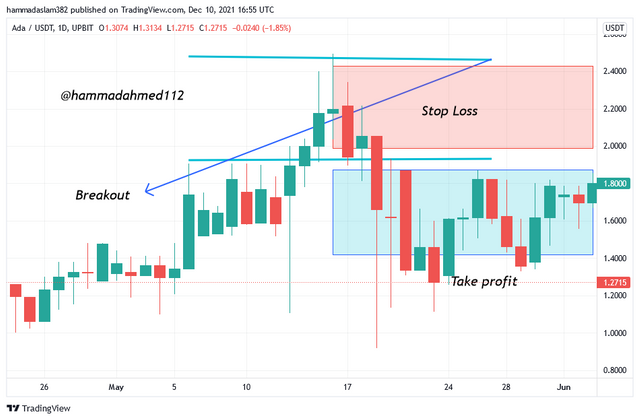
Sell trade Setup:
In the above screenshot, I have setup a sell trade setup for Cardano in usdt pair . first I have to identify the entry-level, breakpoint, and stop-loss and label it on the chart. from the chart, the top of the horizontal line breaks, and the bear run to start. this bear run is the leaving area we have to wait for a time and see what the next movement of price is. if the price goes down so, we sell our trade before the loss.
6. Conclusion:
A rectangle trading pattern is a very effective pattern of trading.
If combined with a indicator, it can help traders in increasing profits.
The price trend and the horizontal trendline are two key strategies to identify this pattern, as I mentioned above.
In the end I am very thankful to prof.@sachin08 to delivering a wonerful lecture. this pattern is really helpful for the new trader because it is very easy to understand and easy to implement. so, that's it for today, I hope you enjoy it.
Regards: