Steemitcryptoacademy || season 3 week 2 beginner course by reminiscence01 || introduction to chart || @hammadahmed112
I am very glad to attempt this session. this session is very informative for me because I am new to crypto. and you all know that the chart pattern and its analysis are very important. basically, the chart pattern, candlestick pattern, etc are count in terms of technical analysis. so, without wasting any time let's get started:
Image created in Canva.
Hey, I am @hammadahmed112 with a new post. today I am writing an article on chart patterns which is given by @ @reminiscence01. this article covers all the important and basic information. before I start I have a request to all my readers that read my article till the end. and give me suggestions if I missed something.

•Explain the Japanese candlestick chart. (A screenshot of the graph is required)
In 1700, a Japanese man named Homma this a chart known as the Japanese candlestick chart. It is a pattern that shows the price movement in the market in a given period and unable the traders to know how the price of assets move and help them to identify the trend in the market and also aid in decision making regarding this. This technical analysis tool helps traders to understand the mood and psyche of the market. The reason the Japanese candlestick pattern is used by 99% of traders is that it can analyze and predict price behaviour.
Here we have four parts of it.
1- open part
2- high part
3- low part
4- close part
1- Open part:
this shows the start of the price movement. This is the opening quotation for a period of time.2- High part:
in this part, the highest price is come to see in specified time.3- Low part:
this part indicates the lowest price recorded in a specific period.4- Close part:
the shows end of the candlestick, closing quotation for the same period of time.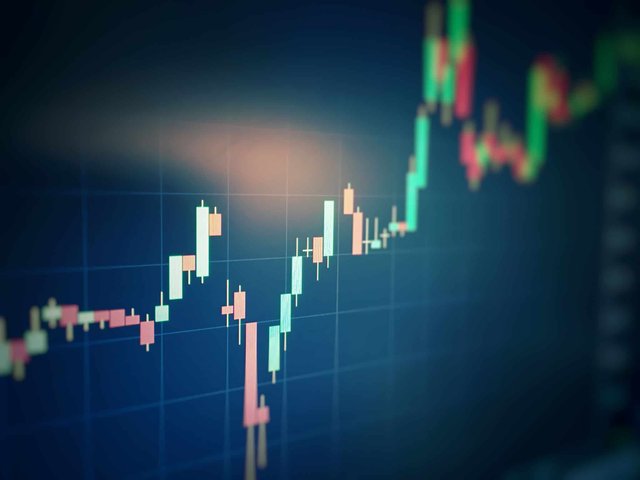
2- Describe any other two types of charts.
Here I'm going to throw light on two more charts beside the candlestick chart.
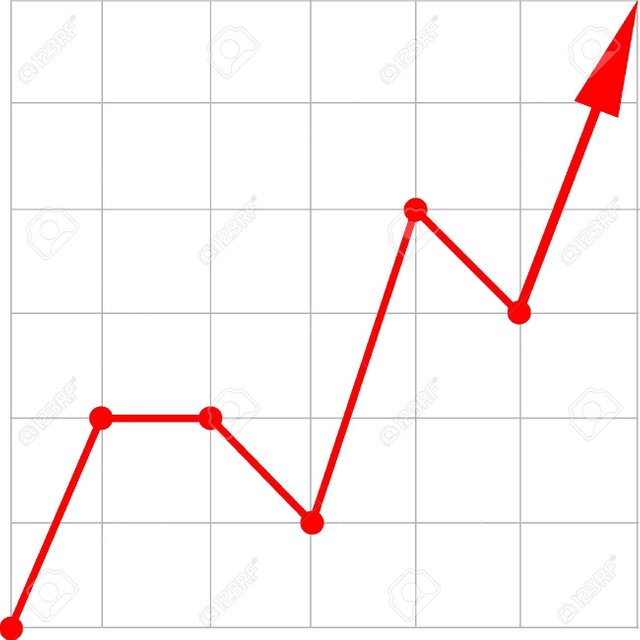
Line Chart:
This is the most basic and simplest type of chart used in finance. A line chart is a chart that gives you information by a straight line segment. This chart is a way of visually representing an assets' price history using a single continuous line. A line chart is easy to understand but it does not provide much data so traders looking for more options to identify a pattern or trend. For example, the candlestick chart.
Bar Chart:
A bar chart is a chart with multiple bars and each bar shows how the price of an asset moved over a specified period. A bar chart depicts the open, high, low, and close prices of an asset.
-The vertical lines on a bar show the high and low prices.
-And the left and right horizontal lines on the price bar shows the opening and closing price.
The bar chart is more advance than the line chart.
)
3- In your own words, explain why the Japanese candlestick chart is mostly used by traders.
There are so many reasons but I'm going to explain only two reasons that why the Japanese candlestick chart is mostly used by traders.
1- Price Movement:
Japanese candlestick chart is mostly used by traders and the main reason behind it that it can determine possible price movement based on past patterns. It provides accurate and detailed information regarding assets' price and traders also easily understand by looking at it as compared to line or bar charts.
2- State of Market:
Just by looking at the Japanese candlestick chart mean its color and length traders can easily determine if the market is strengthening (bullish) or weakening (bearish).
These are the two main reason which attracts the traders towards Japanese candlestick chart and encourages them to rely on it.
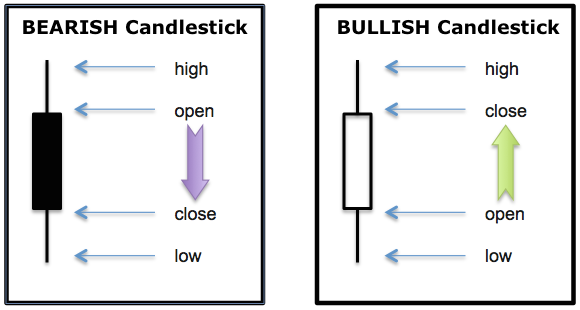
4- Describe a bullish candle and bearish candle identifying its anatomy.
Bullish candle:
The bullish candle pattern is a type of candlestick where the closing price for the asset is higher than the opening price. The bullish candle indicates that there are more buyers than sellers. This great the buying pressure for investors. The bullish candle is represented by green and white color and consists of upper and lower shadows and also composed of the open, close, high, low, and body.
Bearish candle:
The bearish candle pattern is that where the closing price for the asset is lower than the opening price. This indicates the downward movement of price and value of assets also becomes low with a time period. It is the opposite of a bullish candle as it shows more sellers are present in the market as compared to buyers. The bearish candle is represented by a red color or black color and just like a bullish candle, it is also composed of the open, close, high, low, and body.

Conclusion:
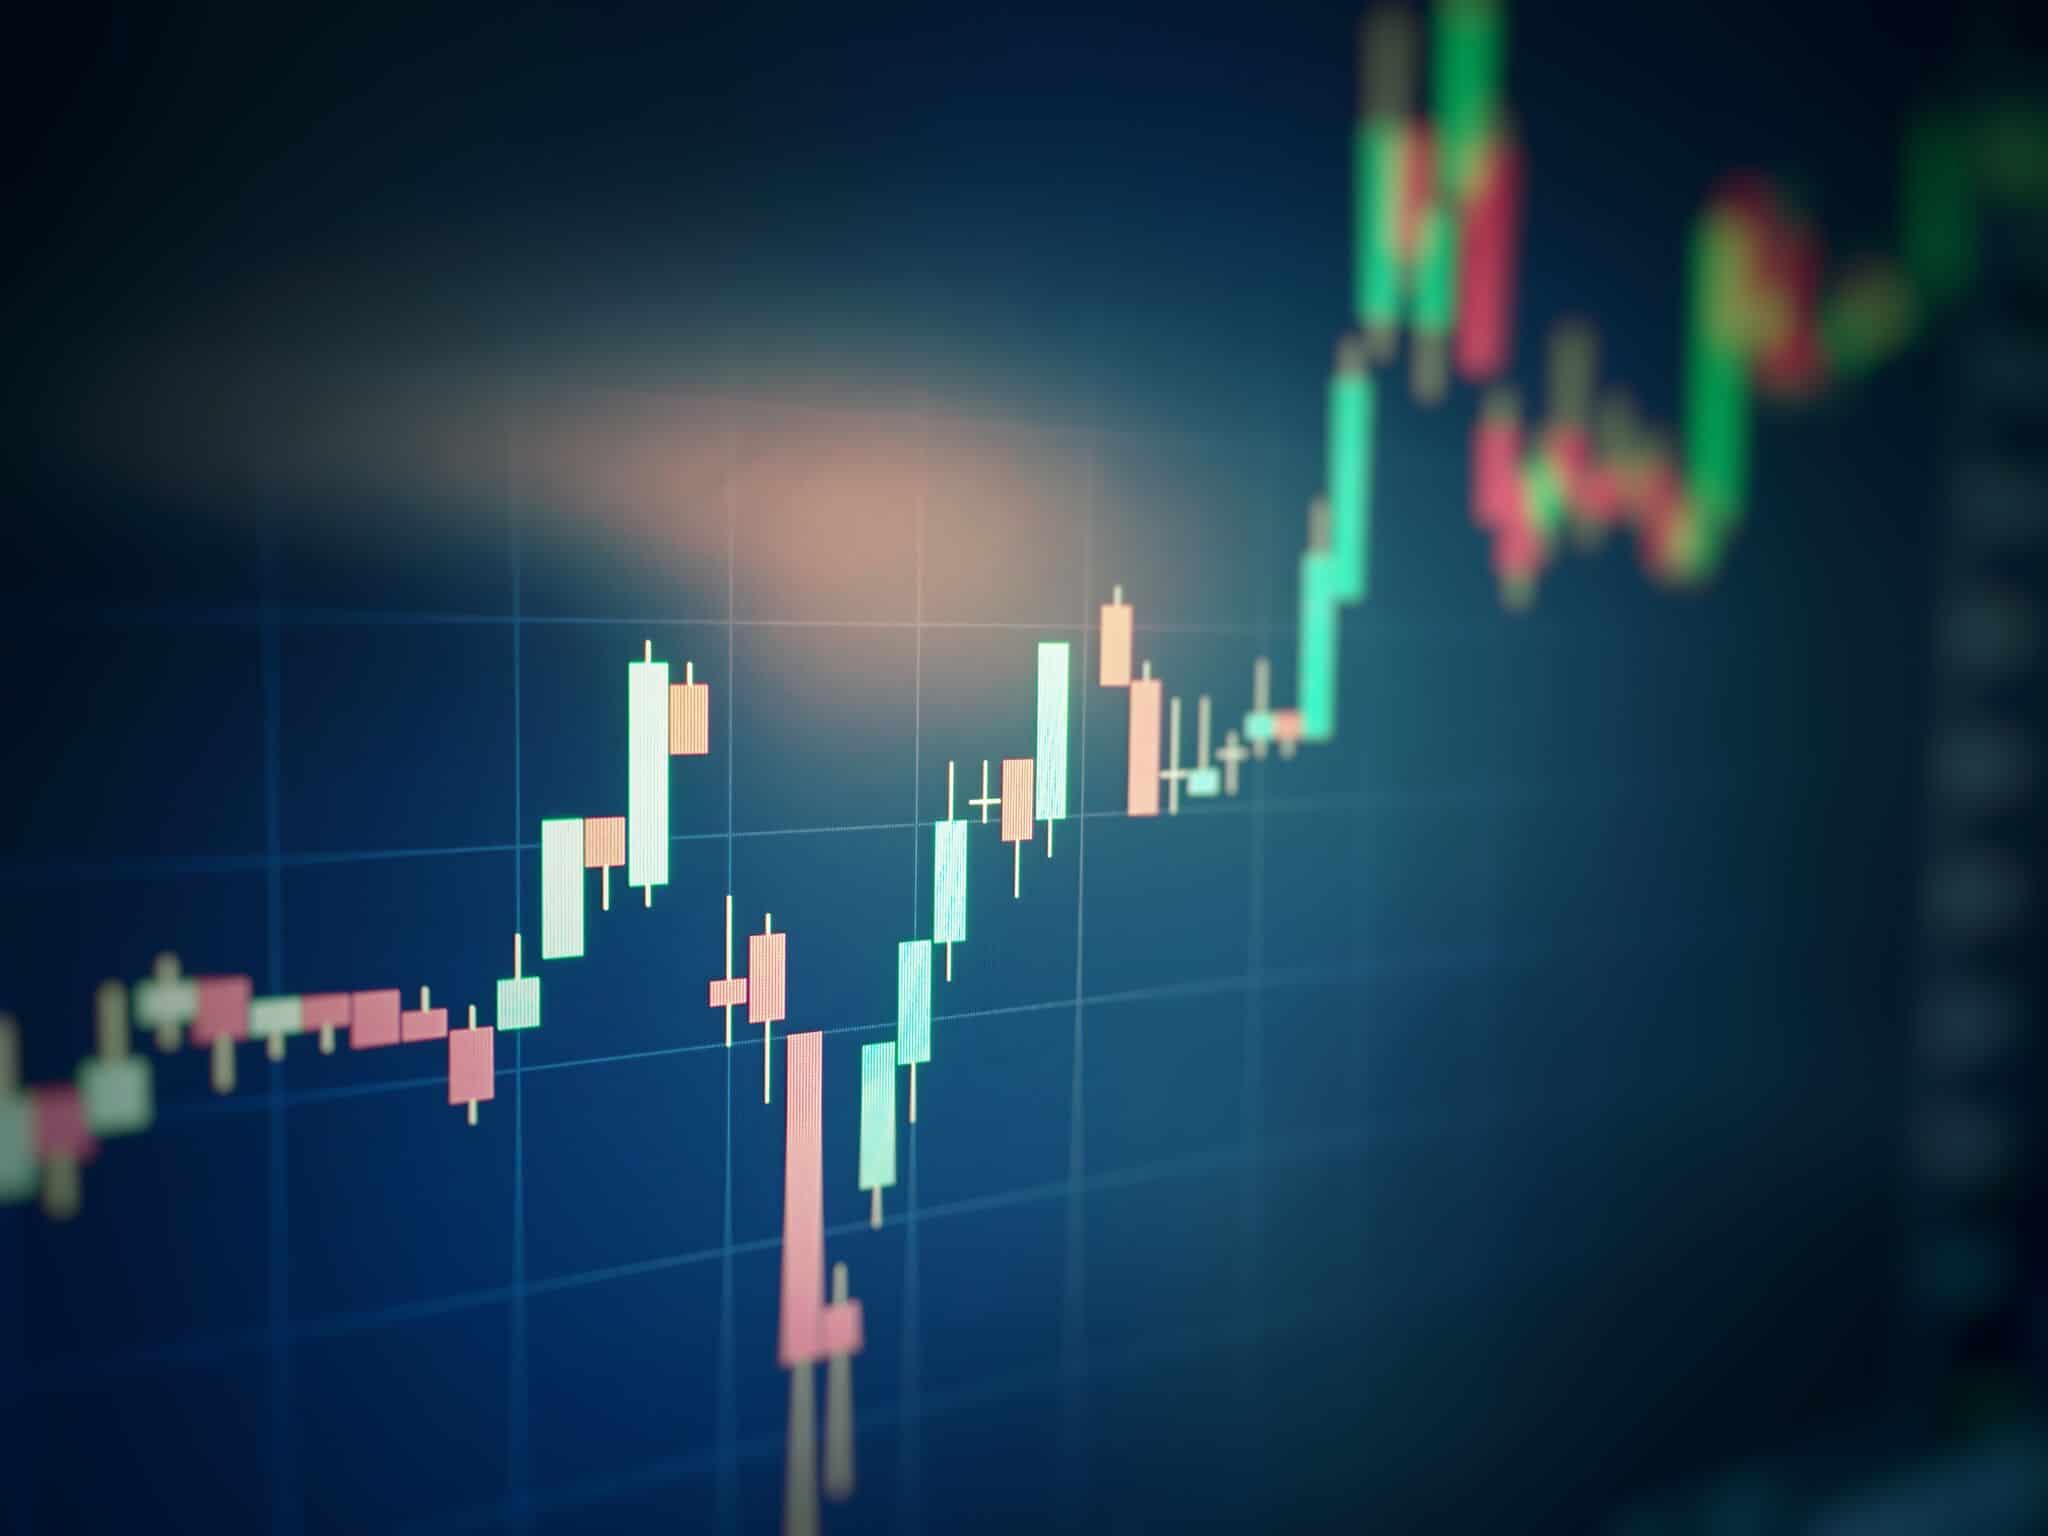
In the end, I will sum up all the important points that are technical analysis is very essential for crypto trading not only crypto trading but also applied on the stock market. this technical analysis can be done by charts in charts there are two patterns one is a green pattern which shows the uptrend or we can say the bullish trend and another is the red pattern which indicates the downtrend or bearish trend. these both patterns can help you to analyze the market situations.
Thanks
IMPORTANT NOTE all the images which I used throughout this article is the copyright image. and their links are also provided below the image.
Special Mentions:
#reminiscence01-S3week2 #cryptoacademy #pakistan #charts #Candlesticks
Hello @hammadahmed112, I’m glad you participated in the 2nd week of the Beginner’s class at the Steemit Crypto Academy. Your grades in this task are as follows:
Recommendation / Feedback:
You did great but i expected more in-depth explanations in candlestick anatomy. Thank you for participating in this homework task.
Thanks, prof. for your feedback.