Steemit crypto academy | Season 6 : Week 2 | Crypto Trading with Moving Averages
Greetings,
Welcome, to all of you guys in my post. here we stand in Season 6 of week 2. this is a great pleasure for me to attempt this post in this wonderful community. so, without any further delay let's move forward:
The Crypto market is fully volatile in nature. means you don't understand what's the next price movement in the market. if you notice the 24-hour chart of BTC so, you don't understand what's the next movement is. so, that's why we need to learn and perform the analysis. so, here there are two types of analysis the very first is Fundamental analysis, and the second one the Technical analysis. both of these analyses are very handy to tackle the situation of price movement.
The Fundamental analysis contains the news which circulates inside the market means this analysis doesn't have any technical point of view. but on the other hand, we have the technical analysis this analysis has a technical point of view. so, today we learn a technical kind of indicator which is moving average.
Moving Average:-
Basically, the Moving Average is the technical indicator that tells us the price movement of any token. before investing an amount we must have a mindset that gives the direction to us as a trader. because without direction or mindset we cannot achieve our goals. so, Moving Average describes the next ongoing movement of price in the market whether it is low or high or what the best point to enter or exit the trade.
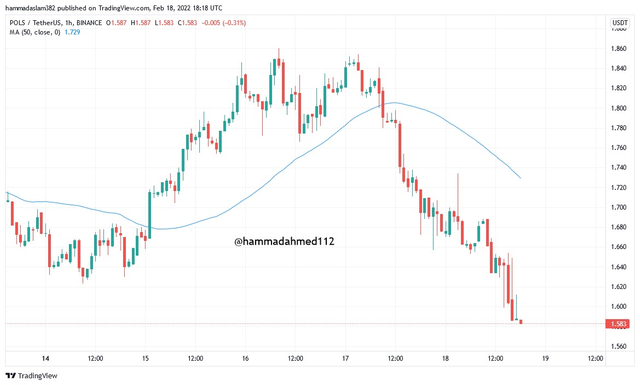
In the above chart, you will see the blue color line which is called an MA. the MA has different lengths which indicates the different days by default MA is 9 which means it shows the previous 9 Day average. in my scenario, I would change it to 50. so, it indicates the previous 50-day average price data.
The 50 MA in the chart shows the bearish market which is in the above image diagram.
Different Types of Moving Average:-
To discuss the types of Moving Average, we have three types that show the different behavior and properties.
Simple Moving Average (SMA) Indicator

Exponential Moving Average (EMA) Indicator

Weighted Moving Average (WMA) Indicator
so, let's go through it one by one.
- SMA Simple Moving Average:
The simplest type of MA is SMA. the simple moving average takes into account a cryptocurrency's average price over a period of time. the simple moving average shows the genuine average price over a certain time period. as the price swings, the simple moving average is plotted dynamically.
let's discuss the formula of SMA to clear and better understand.
SMA = {a1 + a2 + a3 + ......+ a(n)} / n
here,
a = Average data of price movement.
n = No. of days or periods.
- EMA Exponential Moving Average:
It is the updated version of SMA. because in SMA there are some or few lagging points and we don't understand sometimes the price movements. The EMA's goal is to create a moving average that reacts more quickly to recent price changes. the EMA is beneficial to short-term traders since it allows them to obtain current market price information. Aside from SMA, which lags behind price, traders find it difficult to receive timely price signals. Both the SMA and the EMA are vital for making smart trading selections since traders can use them together.
let's have a look at the formula:
EMA(new EMA) = [ cp × (s/1+n)] + EMAp × [1 - (s/1 + n)]
Where ;
cp = current price
EMAp = previous day EMA
s = Smoothing factor
n = number of periods
- WMA Weighted Moving Average:
The weighted moving average is that current price information is more relevant than prior day price information. The SMA and the EMA take previous data points into account more. Meanwhile, the WMA assigns more weight to recent data points, causing the indicator to react to the current price more quickly. the WMA is excellent for short-term traders since it reacts quickly to small price fluctuations in the market.
let's look towards the formula:
WMA = {price1 × n + price2 × (n-1) +...price(n)}/ [ n × (n+1)/2]
n = number of days or periods.
Difference Between them
SMA:
i. In SMA it will consider all the points of data.
ii. In this indicator delays are more than the EMA and WMA.
iii. this indicator is used for spotting long-term market trend patterns.
WMA:
i. The WMA splits the data in a more significant way as compared to other price movements.
ii. The receiving signals strength is far better than the SMA.
iii. This indicator works both in higher or lower values or it can also work for short time period frames.
EMA:
i. The EMA indicator provides the more clear current or previous market price in a very handy way.
ii. the reaction of price changing is faster than the WMA and SMA.
iii. if we talk about the short-term trade so, EMA is the best option. because it is quicker.
Difference Between EMA, SMA and WMA
In this part, we will look at the differences between the SMA, EMA, and WMA to help traders grasp the benefits of each and then choose the best one for their trading style.
| SMA | EMA | WMA |
|---|---|---|
| The SMA considers the average cost of a coin over period | The EMA considers the current price and a smoothing multiplier | The WMA considers the most recent price piece of data while reducing exposure to the prior data point |
| The SMA is appropriate for long-term trend trading because it plays an important part average price to spot long-term patterns | The EMA is appropriate for short-term trades because it interacts quicker to small price movements and also for spotting reversals | The WMA is more sensitive to prices because it concentrates on current statistics for price signals. This is an excellent scalp trading strategy |
| A high-valued SMA is more likely to produce accurate signals. This is due to the fact that lengthier price data points are computed in order to produce a filtered signal. | An EMA with a lower value is thought to be more dependable since the indicator gives emphasis to the most recent price for signalling. | T he WMA is consistent at both high and low levels. This is due to a greater attention on the most current pricing. Even at greater levels, the most recent price is given more weight. |
| The SMA lags behind the price | The EMA reactions quicker to price changes. | The WMA is more sensitive to small price changes. |
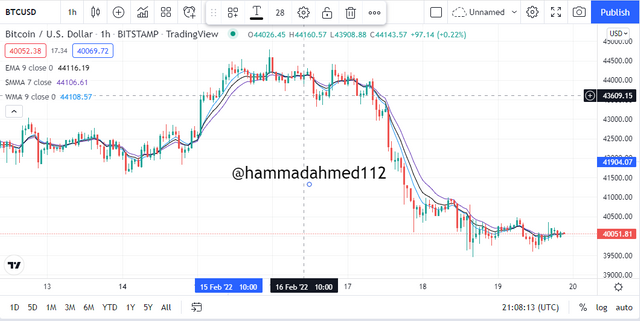
The difference between the three moving averages may be seen in the chart below. The WMA is visible closer to the price because it reacts faster to minor price changes. Furthermore, the SMA is moving away from the price. Although the SMA lags behind the price, it is valuable for long-term traders. The EMA, on the other extreme, appears to be nearer to market as a result of the smoothing applied to the most recent price in its computation, allowing it to react to price fluctuations more quickly.
Identifying Entry and Exit Points Using Moving Average
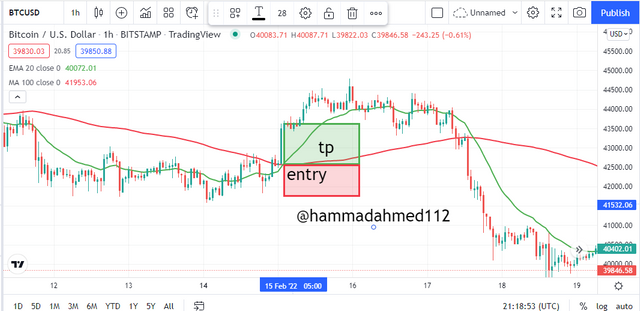
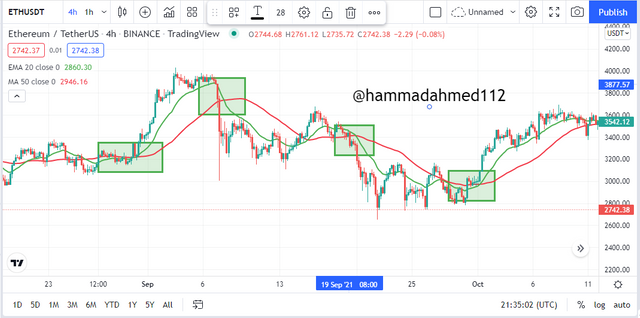
The moving average is crucial in understanding market departure and entrance locations. To demonstrate how we may use moving averages to find entry and exit locations, I shall combine two moving averages. The SMA (50 periods) representing average price data points will be utilised to estimate future price movements. The price is observed trading above the SMA during a strong rally. At this point, we can seek for a buy position by descending to the EMA (20 periods). The EMA is utilised in this case since it responds quicker to price and also shows the involvement of traders in the market.
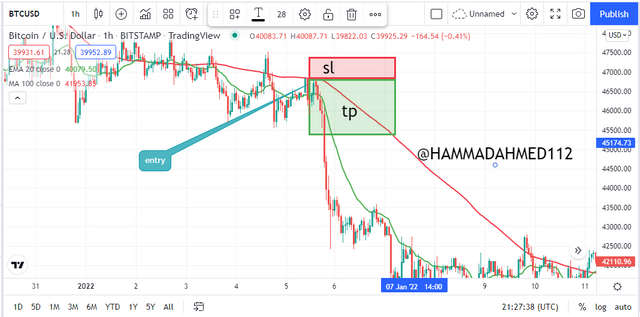
The Exponential Moving Average (EMA) serves as support, as shown in the picture below. I took a buy purchase here, and I discovered that entry point here. The green moving average had crossed the red moving average at this point, and I took a position a bit later. I set my stop loss to be below the red moving average. Previously, the market was negative. However, following the crossover here, the market has become positive. As a result, I took a purchase entry here.
The market in this area was in an upswing before reversing and going downhill. The Exponential Moving Average (EMA) has been identified as resistance in this case, as shown in the image below. I can take a cell entrance here, and I discovered that entry point. The green moving average crossed the red moving average downwards here, and I took a position a bit later. I've set a red moving average subtop stop loss.
Understanding Moving Average Crossover.
Moving Averages Crossover method is very useful for spotting Trend Reversals before they occur on the market.
To do this, we must combine one quicker Moving Average with two slower Moving Averages. This pairing always produces a lucrative signal.
When quicker Moving Averages cross slower Moving Averages, we have a bearish market reversion. As soon as we have a bullish market, we will be able to provide Buy Long Entries. Stop loss would be right below the Slow Moving Averages in this case.
Similarly, when Faster Moving Averages go below Slower Moving Averages, the market experiences a Bullish Reversal. As soon as we have a bearish market, we will have the option to place Sell Short Entries. Stop loss would've been right above the Slow Moving Averages in this case.
Below we can see both bearish and bullish crossovers.
Limitations of Moving Average
Moving Averages are a form of indicator that creates indications based only on historical data. As a result, the Indicator provides just assumptions, not guarantees. Trading on certain indications is not suggested, therefore be cautious when making trading choices based on them.
Moving Average Indicators are extremely useful for determining market trends, entry and exit locations. It does, however, have restrictions. So, before making any judgments based on it, please bear those restrictions in mind.
Moving Averages provide signals based on predefined time periods. For example, if it delivers a buy signal in one hour, it sends a sell signal in four hours. As a result, if traders do not choose the ideal periods for their trading needs, there is a considerable probability of receiving a false signal.
Moving averages do not adapt to current market conditions. As a result, if we trade solely on indications alone, we may lose out on fantastic possibilities.
Because Moving Averages are trailing indicators, we occasionally lose out on wonderful possibilities.
Moving Averages perform effectively in a trending market. Moving Averages, on the other hand, might produce erroneous signals at times.
Conclusion:
At the beginning of the article, I am explaining the technical indicator. the reason for this explanation is to enhance the knowledge of indicators. because it is very important to understand the crypto market. The moving average has been described, as well as how we may apply it to gain important pricing information. We've also highlighted the moving average's limitations to assist you in better appreciating and avoiding losses.
Because it lags behind the current price and only considers historical data points in its computation, the moving average cannot provide 100 percent accuracy and is prone to giving signals. to maximize profit, the signal should be used in conjunction with other technical indicators and price action. understanding and analyzing how the indicator works, are critical to riding on it.
so, that's it for today's article. I hope you enjoy it. this is all from my side.
Thank you!
Regards,