[How to Trade Cryptocurrencies Profitably Using TD Sequential]-Steemit Crypto Academy | S4W8 | Homework Post for @reddileep
Greetings,
A warm welcome to all my readers in my post. this is me @hammadahmed112. today, I write the article which is given by prof. @reddileep. I am very glad to attempt this article. so, without, wasting any time let's move forward:
Edited on CANVA!

(1)Define TD Sequential Indicator in your own words.
As we all know that the crypto market is full of volatility, due to this high volatility we can not identify what happen in the next timeframe. to avoid losses we can use technical Indicators.
Today, we talk about one of the crucial indicators that is TD Sequential Indicator. why I am saying that this is the crucial reason is this indicator is a bit difficult to understand.
TD Sequential Indicator is introduced by TomDemark. this is the technical analysis tool that reduced the chance of loss of our assets in the crypto market. this indicator is used for buying and selling crypto tokens.
it is an indicator that tells us the timeframe to enter and exit the market. it tells the trends when we enter in the market and also tells the reversal when we exit the market.
this sequential indicator also works with the Japanese Candlestick pattern and also works with the Bars pattern. it depends on you what you choose both are the same.
Not any indicator is perfect same concept is applicable to this indicator. before buying and selling we can also draw the support and resistance levels also the Stop loss with TD Sequential Indicator.
(2)Explain the Psychology behind TD Sequential. (Screenshots required)
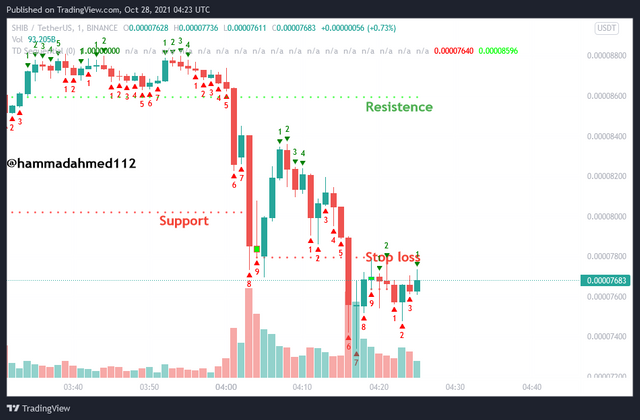
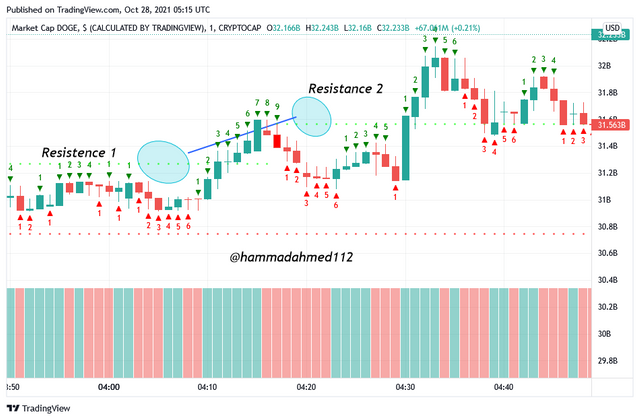
The psychology behind this indicator is very interesting. like TD support levels, TD resistance levels, TD setup phase, and the TD countdown phase. these all things make these indicators more crucial and interesting.
TD support and TD resistance levels tells us the trend and reversals. as we all know that when the market shows an uptrend it touches its resistance level. and if the market show downtrend so, it touches its support level.
In TD Setup Phase. there are two more things which is very important the first one is TD Buy setup and the second and last is TD Sell setup. In both of these setups, there are nine patterns that occur these pattern either in CandleStick and or Bars.
When the market goes up the TD sell setup is starts and when the market goes down so, then the TD buy setup occurs.
when these nine patterns are completed the market makes its corrections and goes down if the previous trend is upward or vice versa. these complete nine patterns show us the buying or selling position.
In both of these charts pattern, you observe that after nine trends patterns one TD buying signal is generated this is the sign of an uptrend. similarly, a TD sell signal is also created after nine reversals. after, the 9 lines the market shows the next trend.
The last phase which is counted in the physclogy of this indicator is Count Down Phase In this phase the 13 lines are generated above or below the patterns. basically, the purpose of these lines is to show the support or the resistance levels.
(3)Explain the TD Setup during a bullish and a bearish market. (Screenshots required)
There are two types of possibilities in TD sequential indicator during the Bullish and Bearish market. one this TD buy setup and the last one is TD sell setup. so, let's discuss both of them in detail:
TD Bullish Setup:
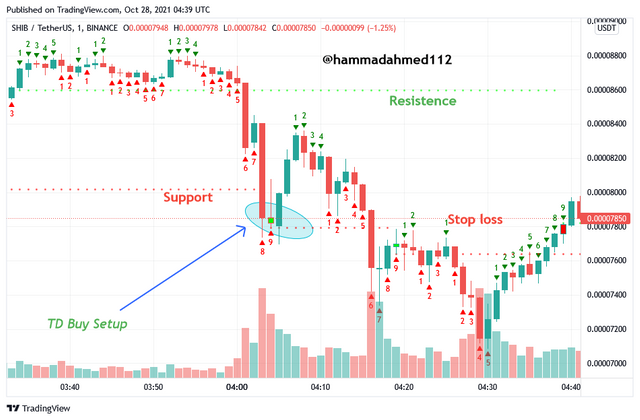
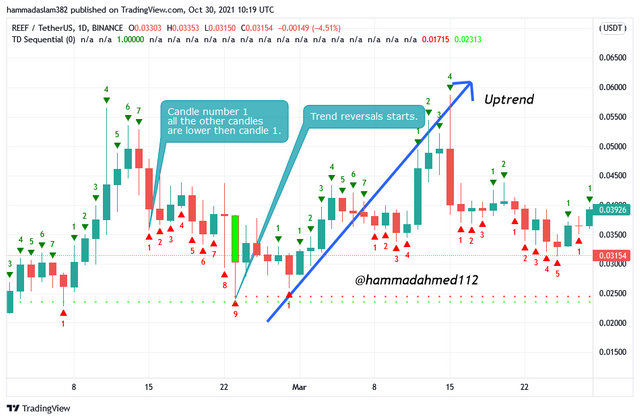
As we all know that the Buying is starts when the market is bearish and give the signal of bullish. so, the people enter in the market to take buy trade. In this TD Sequential Indicator, the procedure of Buying is a bit changed. first, I will show you the graph and then I will explain in detail how its works.
In the above picture, you will see I will highlight the buying point when the market is in dip and shows the signals of Bullish. In this scenario, we have to look at the TD number 1 candle but note that the closing of the TD number one candle is below the 4 Previous candles. These candles must be in a downward direction.
since after completing the 9 candles count there will be a trend starts which is called trend reversals. after this trending market will go Bullish.
TD Bearish Setup:
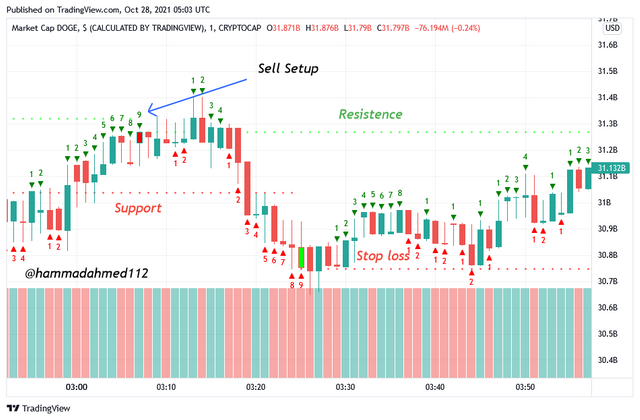
First, of all, we will be add the TD sequential Indicator, and as we all know the sell setup is occur when the market indicates that a bearish condition is a start.
Now, as I previously mentions. we have applied both of the patterns like candlestick or Bars. In my scenario, I have to apply the Candlesticks with TD Sequential Indicator.
sees in the image.
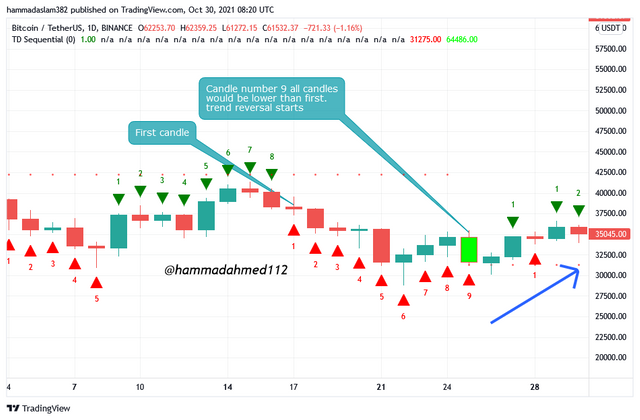
from the above screenshot now I have to explain the working during TD Bearish Setup. as you see the numbers are formed in the pattern. so, we have to consider the number one bullish candle. and compares these candles with the other 4 candles. but, keep in mind that the closing of the first candle is always lower than the other four candles.
From candle one, the next four candles would be above that one. after the 9 candles a trend will be started and this trend is called trend reversal. at this point, we take our position.
(4)Graphically explain how to identify a trend reversal using TD Sequential Indicator in a chart. (Screenshots required)
this indicator is a bit trickable because of its TD values. but by the why I will explain each of these trends uptrends or downtrends according to this indicator in a good manner.
Uptrend Reversals:
Uptrend reversal is working in TD Sequential indicator after the Downtrend reversals end. to identify this we have to follow the following guidelines.
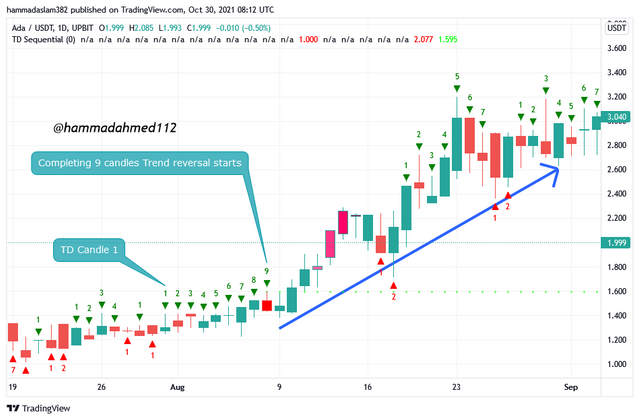
Now, first of all, we see the TD line number 1 candles. keep in mind the closing of number 1 candles would be above the closing of candle number 4.
after candle number 1 goes in upward movements and it will follow the upward directions to number 9, after this compilation of 9 candles a trend will be started. and this trend is called the trend reversal and after this trend, the market moves forward in downward movement.
see in the chart:
Downward trend Reversals:
Downward trend reversals are also work as same in upward trend reversal as the market goes down the price will always go down.
the same procedure is applied on this downward trend reversals. first, of all, we have to apply the TD sequential indicator on the chart in my scenario, I will apply candlesticks on the chart.
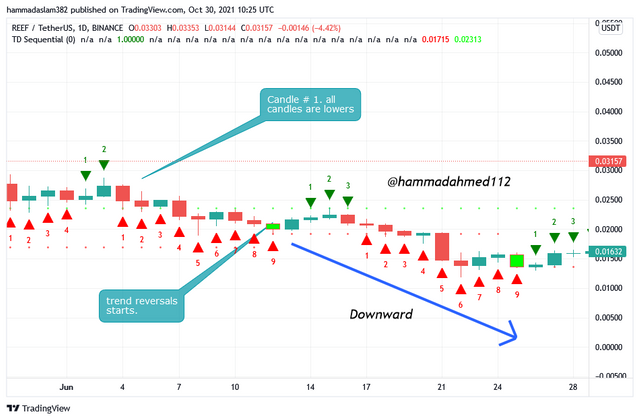
Now, after applying this indicator. we will see the number one candle and the closing price of this candle. the previous 4 candles must be low as compared to the number 1 candle.
as candle number 1 goes in downward the all other 9 candles are also going downward direction. after the 8th candle, the next candle number 9 shows the signal and this signal is called a "trend reversal".
see in the image:
(5)Using the knowledge gained from previous lessons, do a better Technical Analysis combining TD Sequential Indicator and make a real purchase of a coin at a point in which TD 9 or 8 count occurs. Then sell it before the next resistance line. (You should demonstrate all the relevant details including entry point, exit point, resistance lines, support lines or any other trading pattern such as Double bottom, Falling wedge and Inverse Head and Shoulders patterns.)
In this question first I was select my token. In my scenario, I will select the coin ARPA/USDT. before, buying I will do some technical analysis. like entry position and exit position.
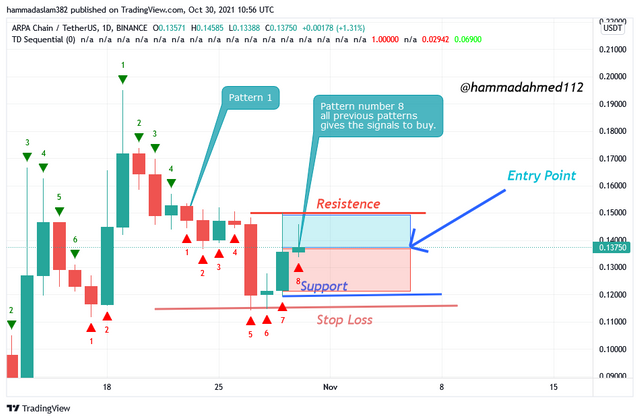
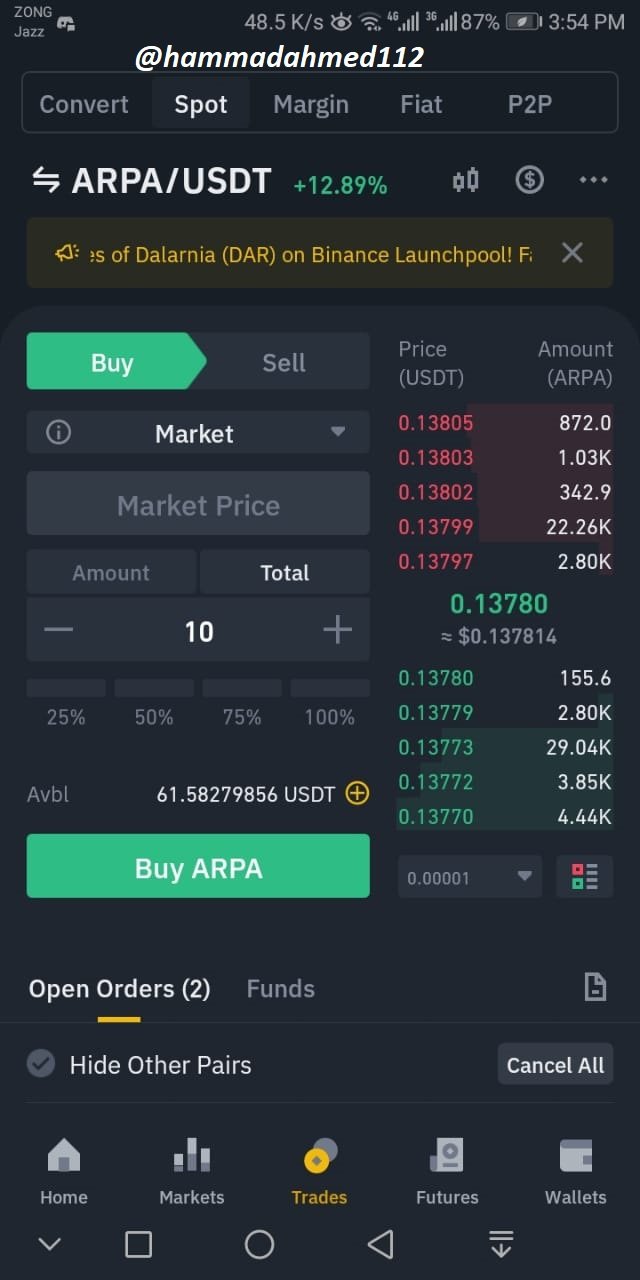
In the above image, the signals would be very strong. because 8 candles meet their positions like or thee resistance and support line is also helping us to identify the situation first candle TD IS LESS THEN THE OTHER 8 CANDLES. so, the current price of this token is suitable for me. so, I will buy the token at the market rate.
so, first I will go to the BINANCE exchange. and do my buy trade.
.jpeg)
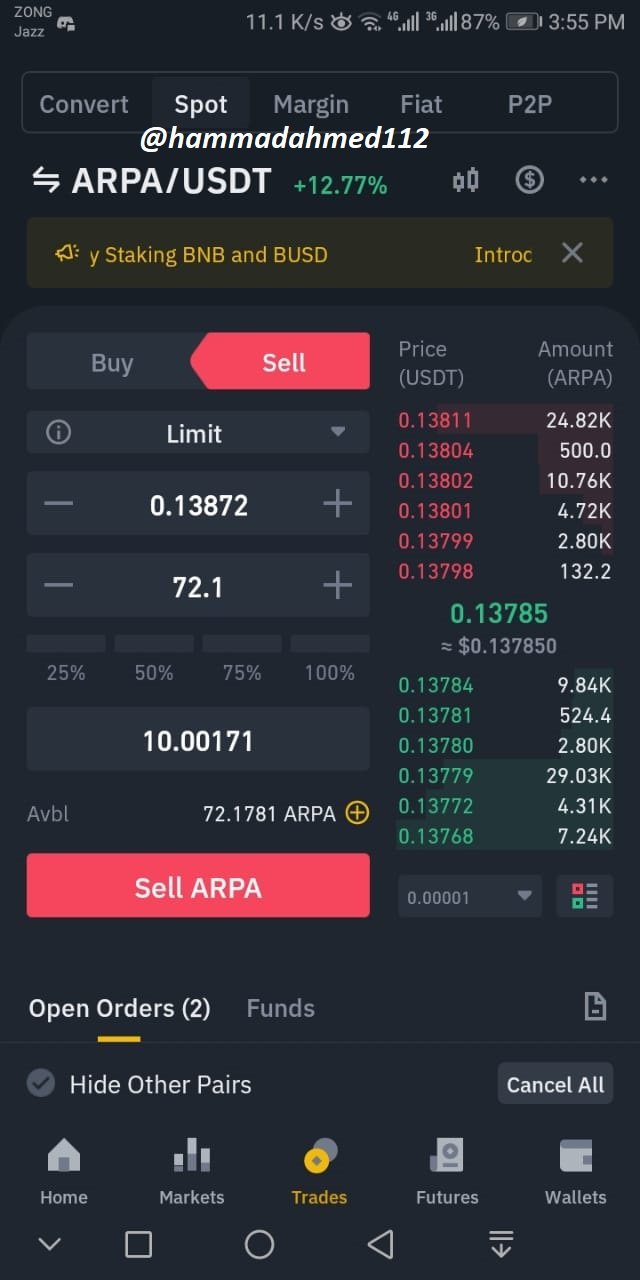
After buying trade now I will set the sell order at 0.13872
.jpeg)
Conclusion:
In the end, I must say that this TD Sequential Indicator is really helpful for me. because the very first reason is it is easy to understand no type of rocket science is required for understanding this indicator. so, I am very thankful to prof. that he gives us a really deep and dive knowledge about the crypto market.
Thanks, for reading my article.
Regards,
#club5050 😀