Fibonacci Tools - Crypto Academy / S6W4 - Homework post for pelon53
Greetings,
A warm welcome to all of you guys in my post. here we are in season 6 and week 4 of #steemitcryptoacademy. today's post is related to the Fibnocacii Tools. basically, it is a technical analysis tool with the help of this we can take a trade. so, without any further delay let's move forward:


Explain in your own words what you mean by Fibonacci retracement. Show an example with a screenshot.
Fibonacci retracement is one kind of technical analysis tool with the help of this tool traders to quickly identify significant levels of support and resistance on a chart of any crypto assets. When we add this Fibonacci retracement to our chart, we can see that it forms at the horizontal level and identifies the support and resistance levels. A trader can quickly catch the trend direction like Bull or Bear and set a stop loss and take profit using Fibonacci retracement.
Fibonacci levels are based on a numerical series devised by the legendary Italian Leonardo de Pisa. It all boils down to a set of numbers that, by adding the previous two, yield a future result, and therefore follow a tremendous sequence indefinitely. The Fibonacci Retracement tool is used in crypto markets to find the price reversal points during retracements whether it is lying is in Bullish or Bearish.
The market condition in which the price of an asset consistently follows a specific trend sometimes Bullish and some time Bearish.
During a trend, the market does not move in a straight line; there are occasional pullback points and we can also say that retracement points where the price does not repeat its previous history the current trend and returns to it after a retracement and pullback.
In a moving market, there are also several levels of Fibonacci retracement tools, which identify different price and retracements levels. The Fibonacci ratio is normally 0, 2,2, 4, 6 ...... so on when using the Fibonacci tool ratio. Each number is the sum of the two preceding or we can say that the previous numbers. Fibonacci ratio percentages are 23.6 percent, 38.2 percent, 61.8 percent, 78.6 percent, and so on. see in the below chart for a better understanding.
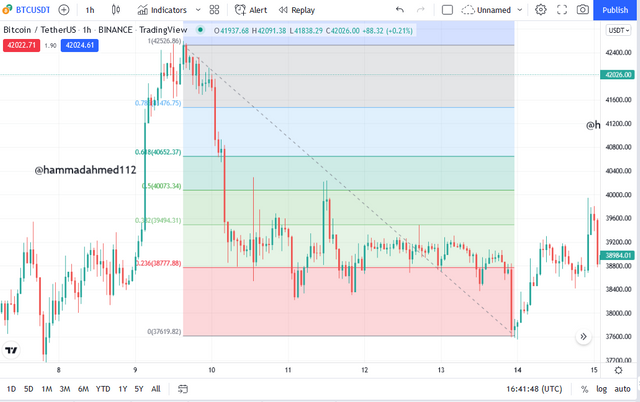
This screenshot was taken from the TradingView platform, and we can see the uptrend market which we can detect using the Fibonacci retracement tool.
Explain in your own words what you mean by the Fibonacci extension. Show an example with a screenshot.
The Fibonacci extensions, like the Fibonacci retracement, identify the different levels of support and resistance of an asset's prices. As prices move up or down in an upward or downward, the Fibonacci calculates the possibility of a price pullback.
Price movement is usually classified as either an uptrend, a downtrend, or a range. In this regard, the Fibonacci extension is a handy tool to use when dealing with a trending market rather than a range market.
We can get considerably better results if we combine the Fibonacci Extension tool combines with the Fibonacci Retracement tool.
Because we can use Fibonacci retracement to find reversal points.
we can use the Fibonacci extension tool to identify the pullback points after we've found them, a trader can combine the two to discover a strong entry position.
To use the Fibonacci extension tool on a chart, begin by creating three points: the beginning of the trend, the maximum price level before retracement, and the lowest point of retracement.
This tool will provide some critical levels where the price may respond in the future; the most important or we can say that it attracts the attention of traders are usually 61.8 percent, 100 percent, and 161.8 percent.
Perform the calculation of the Fibonacci retracement, for the levels of: 0.618 and 0.236. Pick a crypto pair of your choice. Show a screenshot and explain the calculation you made.
Calculation of Fibonacci Retracement:
Formula to calculate Fibonacci retrcments is:
R1 = X + [( 1- %Retracement_1/100) × (Y - X)]
Where
X is the price at which the retracement began
Y is the maximum value that marks the end of the Fibonacci.
%Retracement_1 is the 0.236 ratio
%Retracement_2 is the 0.382 ratio
%Retracement_3 is the 0.50 ratio
%Retracement_4 is the 0.618 ratio
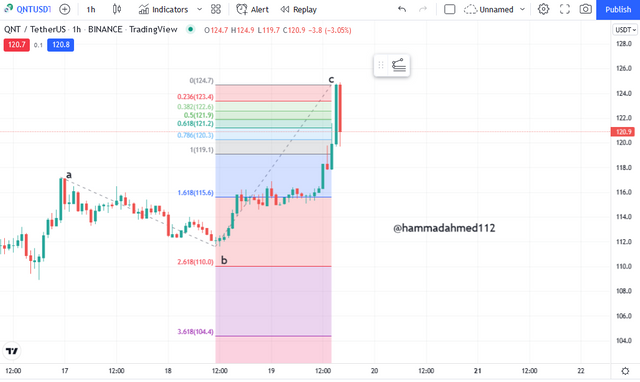
I select the QNT/USDT pair to perform this task:

here,
X = Beginning price value which is 109.0.
Y = final price value which is 124.9.
For 0.618 level:
R4 = X + [( 1- %Retracement_4/ 100) × (Y -X)]
R4 = $109 + [( 1- 0.618) × ( $124.9 - $109)]
R4 = $109 + [(0.382) × (15.9)]
R4 = $109 + [ 6.0738]
R4 = $115.0738
For 0.236 level:
R1 = X + [( 1- %Retracement_1/ 100) × (Y -X)]
R1 = $109 + [( 1- 0.236) × ( $124.9 - $109)]
R1 = $109 + [(0.764) × (15.9)]
R1 = $109 + [ 12.1476]
R1 = $121.1476
Both of the values are the same as to mention in the chart.
On a Live account, trade using the Fibonacci retracement, screenshots are required.
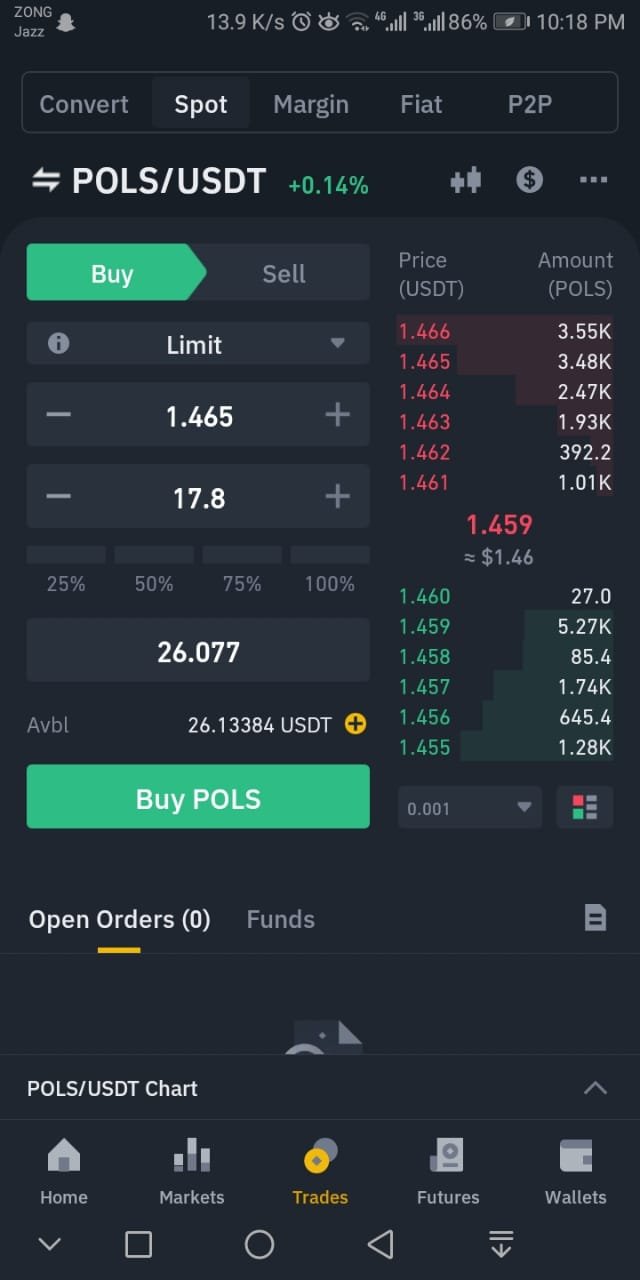
To perform this task which is given in this question. first I need to select any coin pair. so, I select the POLS/USDT in one hour's time frame. after that, I have applied Fibnocii Retracements on it. see in the below chart:
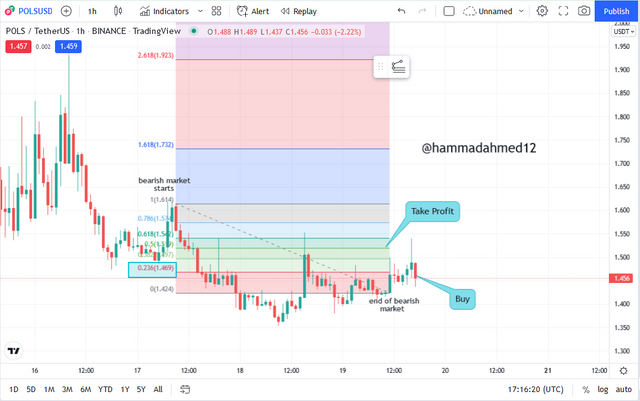
Here, the 0.236 level is acting as resistance. by the passage of time, the price breaks the 0.236 level. 0.382 level as possible new resistance. here I am buying 0.236 level. see the image:
.jpeg)
On a Demo account, make a trade operation using the Fibonacci extension. Screenshots are required.
I'm going to trade a demo at this point, and I'll be using the tradingview platform to do trade analysis and demo trading in Trading View. I'll conduct my study and trade using the Fibonacci extension. to this, I choose the ETH/USDT.
first of all, I draw the points a,b and c on the chart. and then add a Fibonacci extension on it.
see in the image:
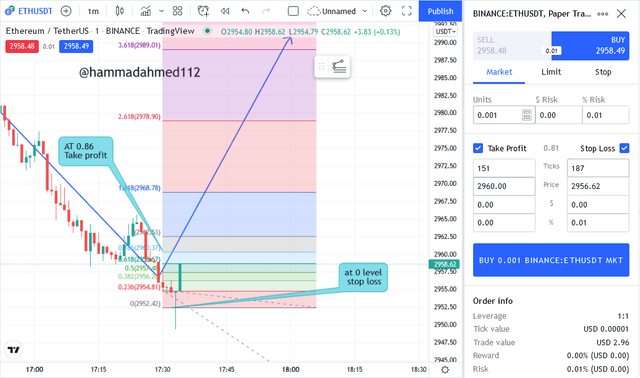
here,
Stoploss = Reracment level 0 at price 2952.42.
takeprofit = Retracment level 0.786 at price 2958.67.
see the chart of buying ETH/USDT:
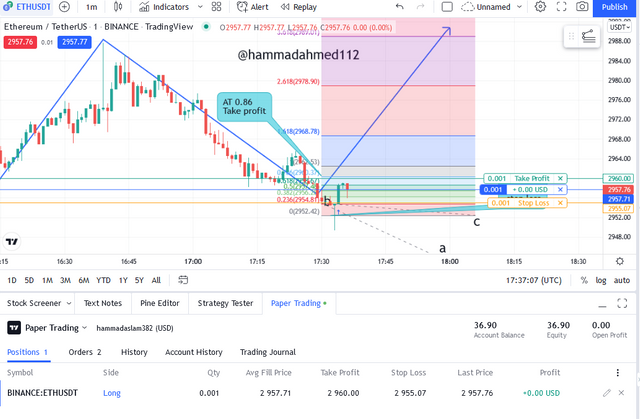
On successful Buying position, the chart image is below.
Conclusion:
The market is said to be made up of demand and supply zones, with buyers and sellers dominating the market, respectively. These zones are recognised for their intense activity and volume injection. The Fibonacci Retracement and Fibonacci Extension, which I have proven experimentally using both trade demo and live account.
so, that's it for today's post. I hope you enjoy it.
Thanks for reading.
Regards,