Crypto Trading Using Trix Indicator - Steemit Crypto Academy - S6W3 - Homework post for @kouba01
Greetings,
Welcome to all of you guys in today's article. this is your @hammadahmed112. I am fit and fine and I hope you are also ok. and live your life full of fun. this is Season 6 of week 3 in steemitcrypto academy. today I summarized the article which is given by prof. @kouba01. before I start my article I must say that prof. gives the best knowledge in the crypto space. so, let's start today's post:

Edited on CANVA

1. Discuss in your own words Trix as a trading indicator and how it works?
The nature of the crypto market is full of volatility. most of the people and the newbie traders lose their savings. the only reason is that people don't know about the term technical analysis and its importance before taking any trade. peoples only believe in rumors and fake news. so, to avoid these losses today, we will be focusing on one of the most useful technical analysis indicators called Trix Indicator"
Trix stands for Triple Moving Average this is momentum or the oscillator indicator which indicates the price in the overbought and oversold regions. this indicator helps the traders to make their decision in the market to make a profit and avoid losses.
Trix indicator developed in the 1980s the founder of this indicator is Jack Hanson. In the early age of this indicator, most people used it. and turn their low investment into higher returns. the reason is simple Tripple moving average reduced the noise in the chart and also avoid the sideways market trend. the Trix moving average filters all types of price movements.
to discuss the Trix we will be also focusing on the resemblance of Trix. the resemblance of Trix is similar to the MCAD (Moving Average Convergence Divergance. the main similarity is the Trix indicator is smooth in terms of noises. while the MCAD contains some noises. let's have a look at the chart of TRIX indicator:

Working of Trix Indicator:
As I discussed above the similarity factor is smoothness. This smoothness factor is made up of combining three exponential moving averages, which helps to deal with price lag and noise, which might result in false signals. The indicator considers all of this and then ignores it, and gives us a signal.
Trix indicator is also useful for the trends and reversals in trading or market structure. Trix indicator resembles the MACD indicator in appearance because of their data which is retrieved from the chart.
The main difference is that the Trix indicator moves with the price action, rather than price lag behind.
The Trix indicator has two sides one of these is the positive and the second is the negative side. and in between the middle point with a value having zero. so, these two sides define the trends for Bullish Trend the indicators cross and move above zero. and for Bearish Trend the indicators move below zero.
2. Show how one can calculate the value of this indicator by giving a graphically justified example? how to configure it and is it advisable to change its default setting? (Screenshot required)
if we want to calculate the Trix indicator. so, first we calculate the EMA's. so, there are three EMA's and we need to calculate each of them one by one separately.
For First EMA:
EMA1 = EMA(EMA, N, p)
Here:
n = period
price = Current Price of token
For Second EMA:
EMA2 = EMA(EMA1, N, p)
EMA1 = price of first EMA.
n = period
price = Current Price of token
For Third EMA:
EMA3 = EMA(EMA2, N, p)
EMA1 = price of first EMA.
EMA2 = price of second EMA.
n = period
price = Current Price of token
with the help of these three EMA's, we can easily derive the price of the Trix indicator. here it is:
Trix indicator = [EMA3(p) - EMA3(p - 1)]/EMA3(p - 1)

Configuration of TRIX indicator:
To configure the Trix indicator the most important setting is the EMA period also say that the Trix line length. so, if we change the setting of this EMA period the trend data would be changed and if a trader does not know about this indicator so, it is advisable not to change the settings. by default, the Trix line length is 14-15 and this is if you good with this indicator so, then you can change the trend line settings.
here I can show you the default and many more settings regarding this indicator.

To change the default setting of Trix first you need to do. to go to the settings icon and click on it after clicking this you will see the inputs, styles, and visibility tabs. see in the image:

Input Tab:
In the Input tab, you will see the three headings which are the TimeFrame, length, and dropdown button on default. see in the image:

The timeframe is default 18 and if want to change this so, you will be easily changed it according to your needs.
Style Tab:
In the style tab, you will change the UI means you will modify the colors. see in the image:

Visibility Tab:
In the last tab, you will change the time frames and show this changing effect to you chart:

3. Based on the use of the Trix indicator, how can one predict whether the trend will be bullish or bearish and determine the buy/sell points in the short term and show its limits in the medium and long term. (screenshot required)
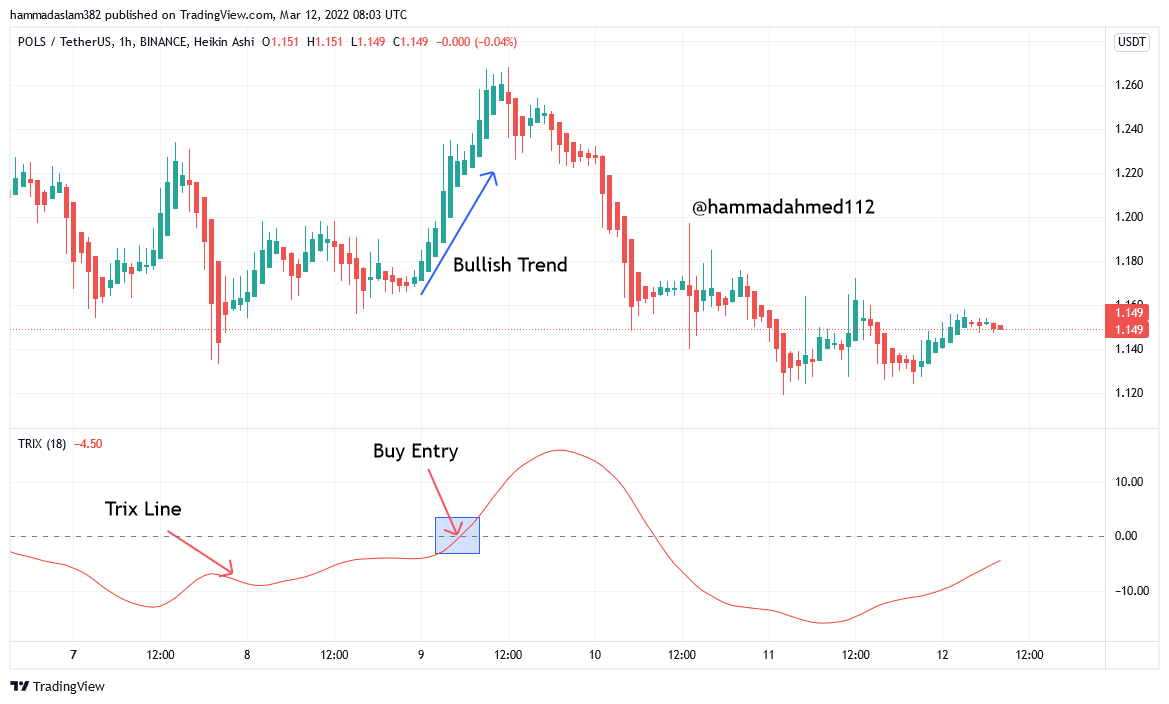
To take trade in the market a trader look for a trend direction whether it is preferable or not. there are various indicators that help us to determine trend direction. As we all know I was previous mentioned above, the EMA is a trend-following the TRIX indicator, which means it is used to determine trend direction. so, there are two scenarios in the market. the very first is when lines are found below the price, the trend is bullish; and the second is when the line is above the price, the trend is bearish.
For Bullish Trend:
In such a case If the Trix line is found above the midpoint which is called zero, we say that the trend at the point is going to be bullish. here is the Buy point entry. because at this point the market going to be bullish.
For Bearish Trend:
when the Trix line is found below the zero midpoints, so, here we is the trend at that point is bearish. here is the Sell point entry. because the market after that point it going to bearish.

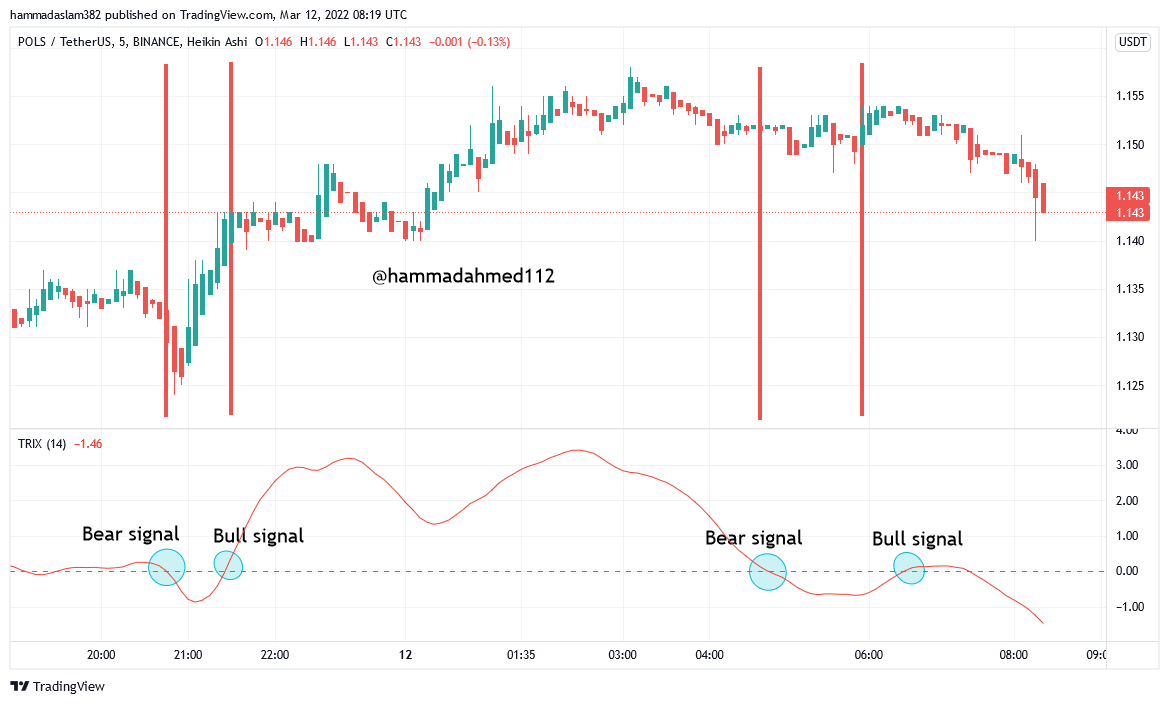
Trix Indicator for Short term basis:
In this section, I will explain to you the short-term trade which gives you the profit in less amount of time. this type of trade is known as Scalp trade. first, we need to select the time frame of the chart. so, I was select a 5 min time frame. let's see in the chart:
Trix Indicator for long term basis:
In this section, I will explain to you the long-term trade which gives you the profit in a long time. In this type of trade, the market is less volatile. first, we need to select the time frame of the chart. so, I was select a 4h time frame. let's see in the chart:

4. By comparing the Trix indicator with the MACD indicator, show the usefulness of pairing it with the EMA indicator by highlighting the different signals of this combination. (screenshot required)
The Trix indicator and the MACD indicator have something in common, as I mentioned at the staring of the article. the feature is the smoothness factor which is common in both EMA and Trix. both the bullish and bearish signals are predicated on a cross above or below the zero midway value.
i. Smoothness:
let's consider the UI differences between the Trix and MACD for Trix I will be considered the 15 and EMA line is considered the 9. and in last the MACD indicator is considered as default value.

ii. Crossover:
In the below image you will see the crossover price of Trix and MACD. both of these crossovers indicate the prices. and also the chart pattern movement. let's see in the graph:

5. Interpret how the combination of zero line cutoff and divergences makes Trix operationally very strong. (screenshot required)
Divergence refers to both the price of an asset and the price of an indicator moving in opposite directions, as we know that, in order to be certain of the market trend, price should move in the same direction as the indicator. Divergence is the term used when the two travel in opposite directions. The purpose of divergence on a price chart is to alert traders to a potential trend reversal that is about to occur in the market.

In the above chart, we will summarize if the zero-line cutoff is observed. so, the price move in a specific direction it is also shown that the market trend is weak and trend reversals are started.
6. Is it necessary to pair another indicator for this indicator to work better as a filter and help eliminate false signals? Give an example (indicator) to support your answer. (screenshot required)
From my point of view, I say yes because the reason is very simple if we use another indicator pair with the Trix indicator, the performance of the indicator will be increasing so more chances of profit. If you don't use another indicator with Trix, it is totally up to you. Trix also provides a very handy analysis in terms of market trends. so, I used the RSI indicator with Trix and described to you the Bullish and Bearish trends.
RSI indicator has two parts one of these is overbought which is above 70 and one is oversold which is in the 30 thresholds.
For Bullish:

For Bearish:

7. List the pros and cons of the Trix indicator
Here are some pros of TRIX.
i. A crossover of the midway, which is zero, is used as a signal for buy or sell possibilities with Trix.
ii. The Trix indicator smooths out price movement using three exponential moving averages (EMAs), effectively removing all noise.
iii. The divergence of the Trix indicator determines trend reversal.
iv .Trix identifies the trends with crossing over the midpoint.
here are some cons of TRIX.
i. TRIX sends out signals that are late. some times due to this delay we can lose an opportunity and don't make profit.
ii. The TRIX indicator should not be utilized as a stand-alone indicator.
It's not that any indicator should be utilized as such, but Trix is too reliant.
- Conclusion:
Trix indicator is a technical analysis tool. It smoothes out the pricing and eliminates market noise. on the other hand, causes it to lag so badly that it's perfect for sending late signals.
It can provide very useful cutoffs when paired with an EMA.
After an EMA cutoff, passing the zero line acts as a confirmation.
It's also possible to use it with two TEMAs.
so, that's it for today's post. I hope you enjoy it.
Regards,