Crypto Trading Strategy with Median Indicator - Steemit Crypto Academy - S6W4 - Homework Post for Professor @abdu.navi03
Greetings, to all Steemit members:
I hope all of you guys are good in your life. yet, again we are in another week of SteemitCrypto Academy. this is week 4 of season 6. today's post is related to the technical indicator. before, I start I appreciate the prof. @abdu.navi03 to deliver this wonderful lecture. so, without any further delay let's move towards the topic:

Explain your understanding with the median indicator.
Everything in this world follows rules and regulations like a bird flies in the sky, water flows top to bottom, etc. so, in our daily life, we buy and sell some commodities related to our daily life routines. like an investor invest his money to buy shares. all of these things required some rules or methods.
let's consider I have $50 dollars and I invest this money in the crypto market. so, what do I do before investing my money? obviously, I required some knowledge and this knowledge in terms of analysis. so, there are two types of analysis. Fundament Analysis and the Teachincal analysis. both of these analyses give me a good piece of knowledge.
The Median Indicator is lying in the Technical analysis domain. this indicator helps to find the trend direction in the market. The Median indicator compares the median value of high peak and low peak in a certain time period and compares it to EMA(Exponential Moving average) in the same time period. the outcome of both of these time periods shows in the chart with a different color. the cloud of color depends on the line having a high value. this indicator understands the trend and generates trade signals using the color cloud scheme. this cloud color scheme provides the UI for a better understanding of both buyers and sellers.
The color cloud that appears in the median indicator represents the trend and trend reversal. A green colouring indicating an uptrend when the median value is higher than the EMA value indicates the Bull run. When the EMA value is higher than the median value, a purple coloration appears, indicating Bear market.
Parameters and Calculations of Median Indicators. (Screenshot required)
Parameters of Median indicator:
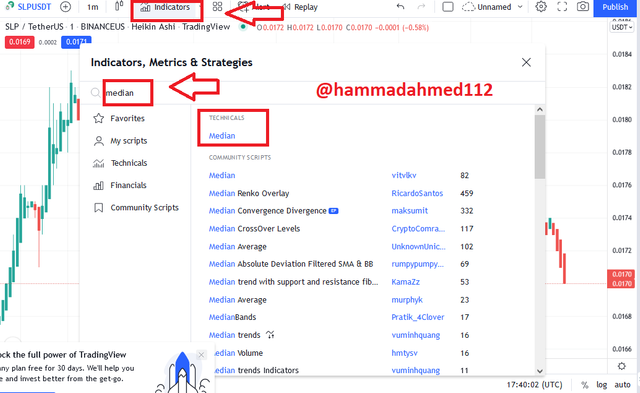
To get the parameters of the Median indicator, go to any price chart platform. I used the tradingview platform for this example.
To begin, go to Tradingview's website and go to the platform's price chart section. Search for the Median indicator in the indicator menu and type media. Then, click on the median it will add to the chart.
From the above image, you will see the chart having a median indicator now. go to the Setting icon of this indicator and click on it. so, you will see the new tab will be open and there are three fields like Input, Style, and Visibility. let's see all of these ones by one:
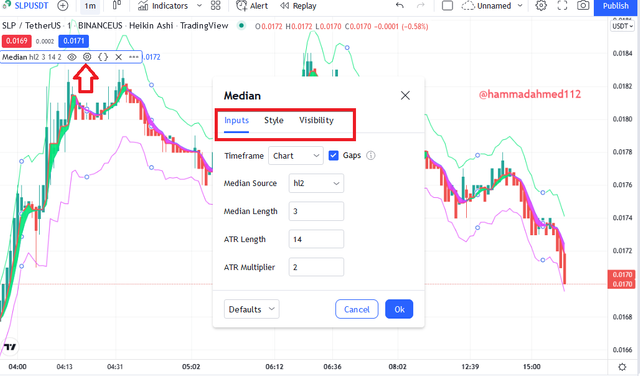
Input Tab:
in this tab, you will see the following parameters which are the median source, median length(period), ATR length, and ATR multiplier.
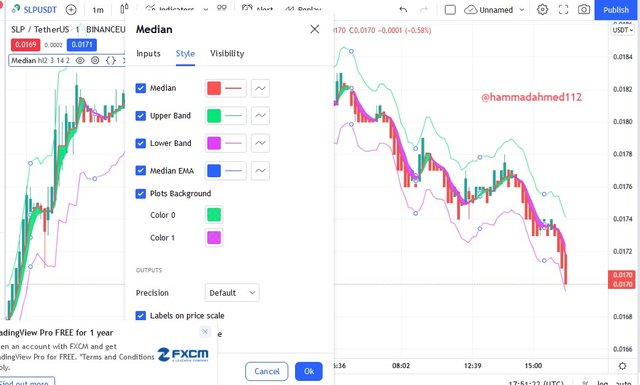
Style Tab:
In the style tab, you will change the colors of the cloud with respect to your choice.
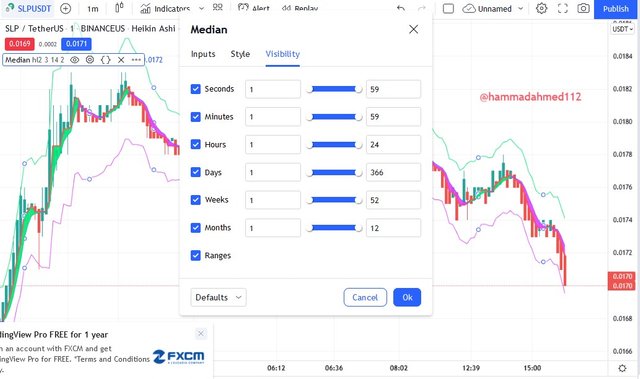
Visibility Tab:
In the style tab, you will change the time frame of the cloud with respect to your choice.
Median Indicator Calculation:
there are the following parameters that help to calculate the value of the median indicator.
Median length= when the procedure is completed, its factory value is 3.
ATR = The factory value of 14 is the number of periods discovered by calculating the median of ATR.
ATR multiplier = (closing price × multiplier) + EMA (previous day) × (1- multiplier).
Upper band = median length + (2 ATR).
Lower band = medium length - (2 ATR).
Uptrend from the medium indicator (screenshot required).
It is simple to discover and illustrate the trend by using this indicator.
In this scenario, we'll use an upward trend, so we can understand what's going on in the market owing to this indication.
after applying the indicator on the chart it displays a color that corresponds to each of the indicator's functions. The green color shows the oscillator point and this point is the buy point, which is where we will enter our trade. remember one thing we are in an uptrend the green line is above the EMA.
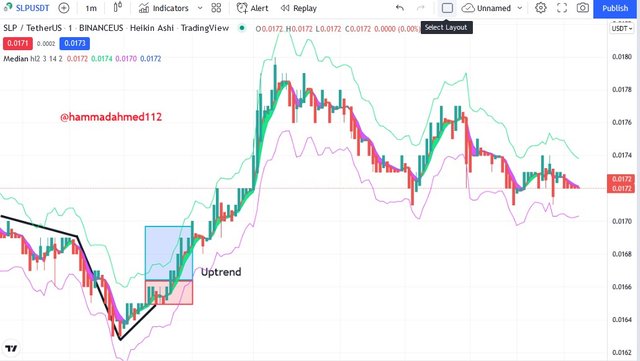
The selling point, or the shift from a downtrend to an uptrend, is indicated by the oscillator line turning purple. With all of this information, we must consider that by using this indicator, we may have a better understanding of the next movement in the market and make better investment decisions.
Downtrend of the median indicator (screenshot required)
Because it is a trend-based indicator with moving average characteristics, it also provides the downtrend. The downtrend is determined also determined is same as the uptrend means we identify with the help of cloud color and this determined by the difference between the median and EMA values.
A downtrend is identified when the color of the cloud turns purple, indicating that the EMA value is higher than the median value.
Let's take a look at the chart below.
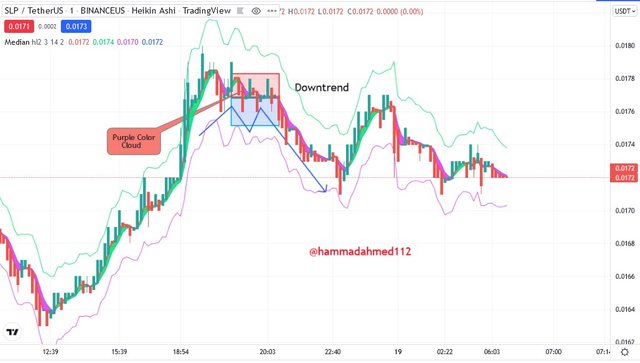
The indication cloud on the chart above has changed color to purple, indicating a negative trend. A bearish signal is here, and traders can place a sell order.
Identifying Fake signals with Median Indicator
In general, there is no indicator that is accurate or efficient completely. And, because of this, the market gets their signal from previous price data points, they can provide misleading signals. As a result, the Median indicator is included, which implies it can produce fake indications.
so, to avoid fake signals we can use the RSI indicator as we all know that this indicator is the Volatility based indicator. that provides the technical support to the chart and previous data points. in the region of overbought and oversold. When the RSI is above 70, it indicates a bearish trend reversal, whereas when it is below 30, it indicates a bullish trend reversal.
see in the chart:
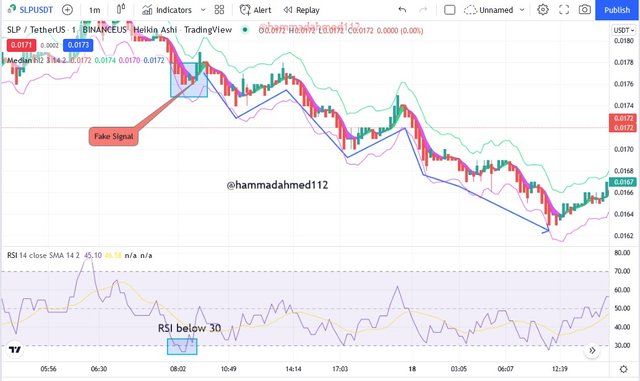
there is a wrong indication between both of these indicators in the above chart. As a result, if you want to prevent misleading signals, you should wait for both indicators to offer a good signal before taking any trade. In this chat the combination of both indicators shows the very handy trading signal when using both of these indications to remove false signals, and keep in mind they should agree on a market opinion.
Open two demo trades, long and short, with the help of a medium indicator or a combination including a medium indicator (screenshot required)
In this section, I will conduct the analysis and demo for utilizing the tradingview website, and the deal will be executed on my paper tradingview account.
Buy Trade:
For buy trade first of all I select the token pair. so, I will select the BNB/USDT for a one-hour time frame. first of all, I was perform the analysis on it. after analysis, I will add one more indicator which is RSI to confirm of signal look at the chart.
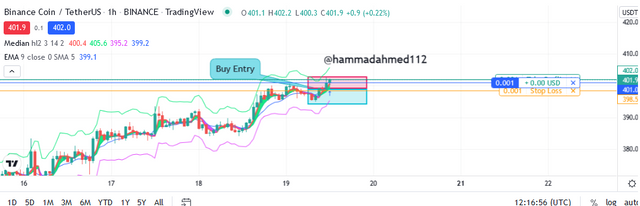
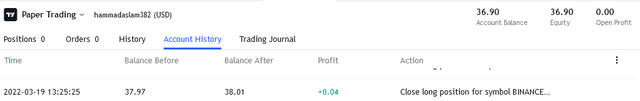
from the above chart, I will set the take price, stop loss, and profit limit. after waiting to hit a signal it takes a time to get executed. after a time the trade executes properly. see in the chart.
Sell Trade:
For sell trade first of all I select the token pair. so, I will select the ETH/USDT for a one-hour time frame. first of all, I was perform the analysis on it. after analysis, I will add one more indicator which is RSI to confirm of signal look at the chart.
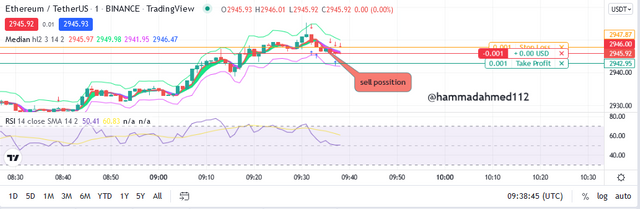
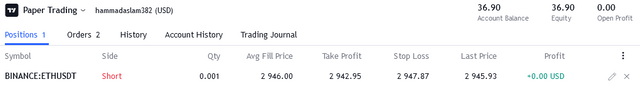
from the above chart, I will set the take price, stop loss, and profit limit. after waiting to hit a signal it takes a time to get executed. after a time the trade executes properly. see in the chart.
Conclusion:
The median indication is a cloud of green and purple colors that represent a bullish and bearish trend, respectively. When the trend is bullish, a green cloud forms and a buy entry position may be placed at any point; when the trend is bearish, a purple cloud forms.
To filter out the fake signals keep in mind we used the RSI Indicator. that helps us to generate the true and profitable signals.
so, that's the end of today's post. I hope you like it.
Thank You!
Regards,