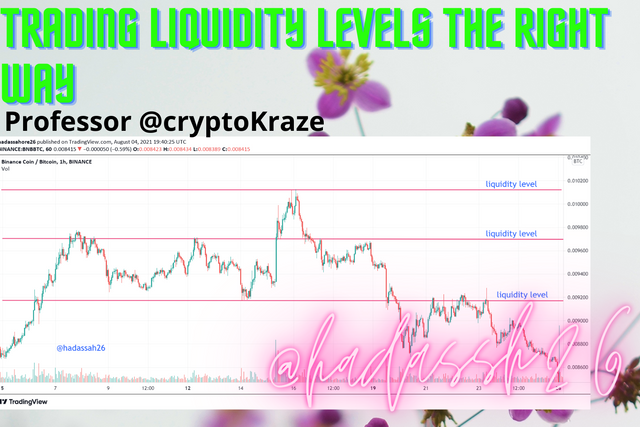
Crypto Academy / Season 3 / Week 6 - Homework Post for [@cryptokraze]. Trading Liquidity Levels The Right Way
As much as we all try to draw empirical technical analysis to market charts, we should all know deep down that the market is controlled by two sets of traders:
- Retail (Small money) Traders
- Institutions (Very Big Money) Traders.
This truth most newbie retail traders are unaware of making them prey to institutional money movers.
Now let us go in detail:
The whole concept of Support and Resistance is basically “Caution”. Caution areas both from big money and small money trader, but with both trying to make profit from each other it becomes a “Thug of war”, “Surf or Drown” kind of game.
While big money traders try to lure and pull profits of retail traders, retail traders on the other hand are trying to “ride” the trend of big money traders, all with the hope of making profit.
Understanding this concepts brings about the idea of Liquidity Level and fake outs/ Break outs.
Good day beautiful Steemians, I am @hadassah26, welcome to my Steem crypto academy season 3 week 6 homework for professor @cryptokraze on : Trading Liquidity Levels The Right Way

”1. What is your understanding of the Liquidity Level. Give Examples (Clear Charts Needed)”
Liquidity levels in crypto market can simply be understood as places where Big market moves are made.
These places which usually are Support and Resistance levels are not caused by random computational algorithms, but by Human psychological effects such as Caution, Expectation, Fear, Greed, etc
With these levels having high Trading volumes, and usually Reversals, we see candle stick patterns such as the hammer, hanging man, and pinpars at these areas.
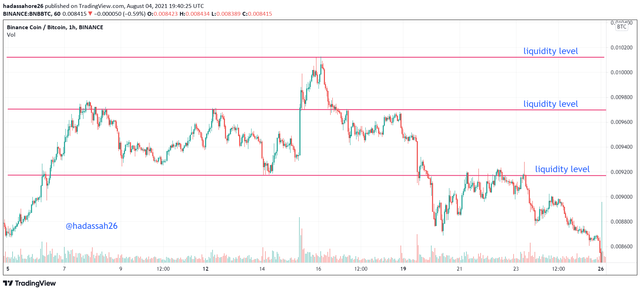
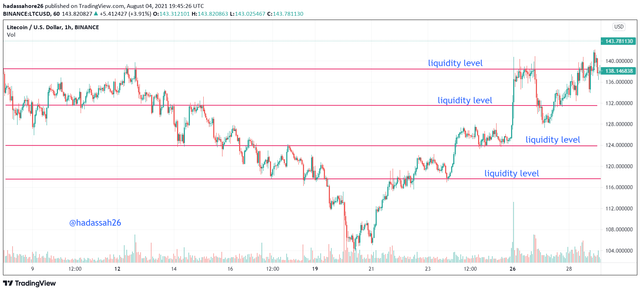
From the charts above, we see liquidity levels, which usually become points of reversals can also be support or resistance levels. if price momentum is strong enough it breaks this levels and forge further.
”2. Explain the reasons why traders got trapped in Fakeouts. Provide at least 2 charts showing clear fakeout.”
From our introduction, we said big institutions try to pull profits from retail traders, by playing with liquidity levels.
From number 1, we talked about expectation and support and resistance. Retail traders watch(expect) for major support and resistance levels to trade market reversals setting their stop losses at reasonably comfortable distances.
But big money institutions on the other hand play the game Buying or Selling more at these areas so price goes against the general sentiment on these zones thereby hitting stop loss levels of the retail traders, this way they make profit from retail traders then let the market trend back to its initial direction. Unsuspecting/inexperienced traders fall prey to these moves and lose the game to big money institutions.
These liquidity levels play are called Fake outs in technical analysis terms, and occur often on major support and resistance zones usually after some consolidation.
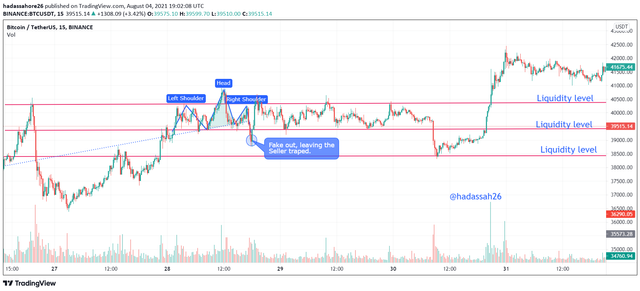
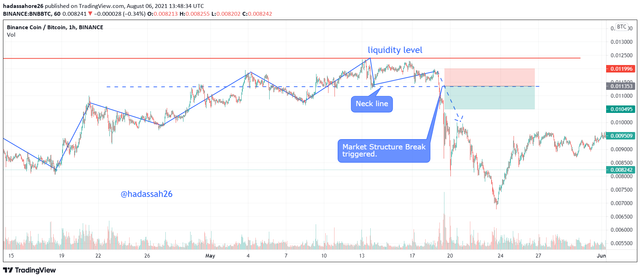
From the BTC/USDT chart above, we see that after the head and shoulders formation by prices, retail traders will most likely be hoping for a downward trend. But this is played by institutional money as a quick bullish run is now made by price then it consolidates and then comes back down after a while before trending back up. This is a classic case of a fake out.
Price after a triangle pattern consolidation is seen to want to make a bull run, but quickly turns back down and heads straight down causing retail traders to be trapped in their Buy positions. This is another case of a fake out by price.
”3. How you can trade the Liquidity Levels the right way? Write the trade criteria for Liquidity Levels Trading (Clear Charts Needed)”.
Liquidity levels though now seeming tricky to trade, can be successfully traded using the idea of Price Momentum
Price momentum trading can actually be traded using different strategies, but for this assignment we shall be explaining it with MSB Market Structure Break, BRB Break Retest Break strategies and moving from higher to lower timeframes to better execute these trades.
MSB: Market structure Break for Liquidity Levels Trading
Market Structure Break strategy majorly used to detect reversals around liquidity levels, can be viewed in details as treated in the previous article.
Market Structure Break strategy uses the concept of watching the market for trend weakness, and trading reversals on confirmation. This Strategy which helps traders avoid liquidity level play at reversals, gives them a good price momentum confirmation signal allowing them ride the reversal trend properly.
The Market Structure Break Trading strategy follows as:
- Wait for market trend to show weakness / price showing trend discontinuity
- Mark previous Support or Resistance line also called Neckline.
- Wait for price to clearly break the Neck line confirming a reversal. Then place short or long position.
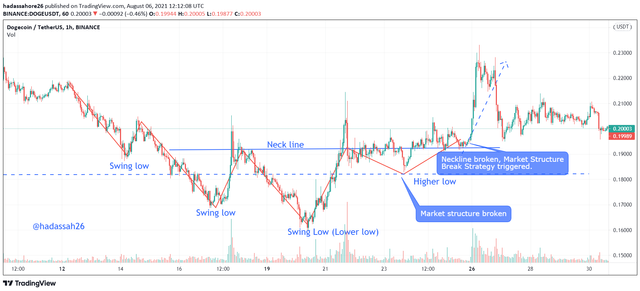
From the above chart, we see a good case of Market Structure Break strategy, price forms a new higher low after its downward structure formation, then it breaks the neck line and a good example of market structure break strategy is formed.
BRB: Break Retest Break Strategy for Liquidity Levels Trading:
Break Retest Break strategy majorly used to trade trend continuation can be viewed in detail as it was treated in the previous (article](.......)
The Break Retest break strategy uses the concept of following price momentum as market follows a structure either uptrend or downtrend.
This strategy allows retail traders trade real areas of market momentum pump and avoid liquidity play by big money institutions.
The blue print for the Break Retest Break strategy is :
- Watch for price momentum in either direction (Uptrend or downtrend)
- Draw out swing highs and swing lows structure of the trend
- Mark next support or resistance level.
- Watch for price to break that level, pull back and re-break that level.
- Now take long or short position a little after the previous price break level.
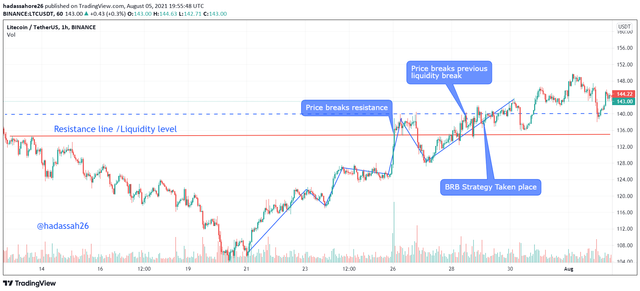
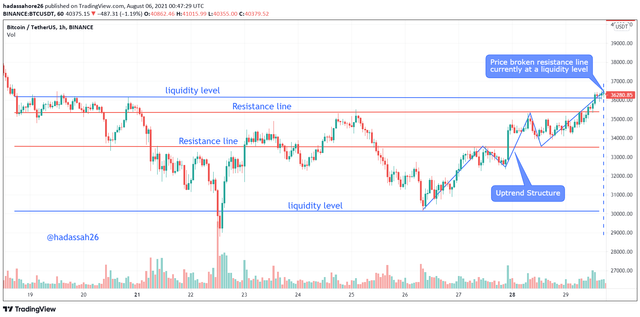
The break retest break strategy is shown in the above chart, price trends in an upward trend direction, it then breaks the imminent resistance/liquidity level and then retraces back again, retesting the same resistance level.
Price then trends back up and breaks the previous liquidity break level, this is a good case of Break Retest Break strategy .
Moving From Higher to Lower Timeframes to Better Execute These Trades
Moving from higher timeframes to lower timeframes is more like taking price candlestick like a tube, where smaller timeframes candlestick are inside higher timeframes candle tube.
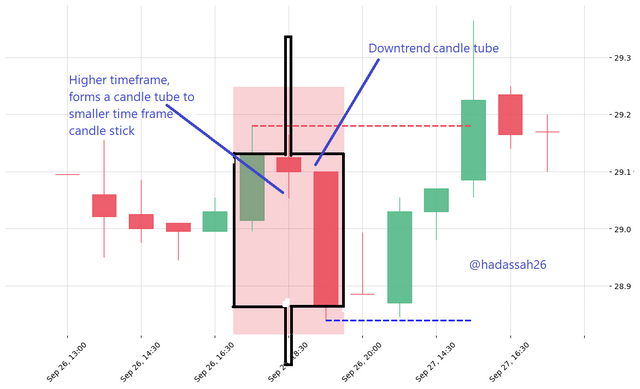
So knowing the general direction of higher timeframes, retail traders already have a clue on the next direction of liquidity levels at lower timeframes.
Example
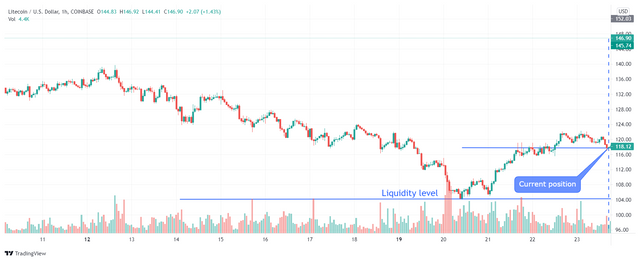
Looking at the chart above, we see price is currently at a liquidity level, we can now use a higher timeframe to know the general sentiment regarding this case scenario.
Looking at the higher time frame, we see price is having a big downward zig-zag motion, one that has now retraced up breaking its previous resistance level and would soon be finding some retracement back downward.
We are now sure of a downward retracement from price.
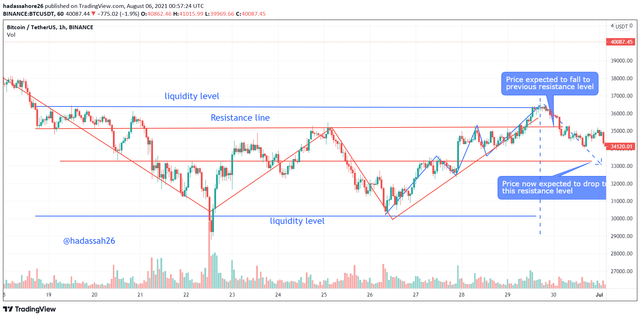
Here we see price at the lower time level has conformed to the higher timeframe which makes us watch the previous resistance level as the new support level.
Price quickly breaks it and we go lower to a lower support level as the new expected liquidity level.
Write the trade criteria for Liquidity Levels Trading (Clear Charts Needed)”
From the above points we see that price momentum trading for liquidity levels is important as it allows retail traders avoid liquidity levels play by institutional money.
Merging all we have learnt and talked about, we can give a general criteria for liquidity level trading as:
- Watch price higher timeframes to know exactly where the trend is going.
- Watch price lower timeframe for market structure and momentum.
- Properly mark liquidity levels.
- Now from market structure, know if price is continuing trend or reversing.
- If price is continuing trend, use the "Break Retest Break Strategy"
- If price is reversing from trend, use the "Market Structure Break Strategy".
- Trade properly setting adequate Stop loss and take profit.
Taking an Example
From our above explanation, we can now take a very good example to show how to trade properly Liquidity levels.
From the above chart, we are at a mini retrace ment during a slanty uptrend, we are unsure of what price is originally doing and how to go about it via price structure.
So we go to a higher time frame to have a better view of price.
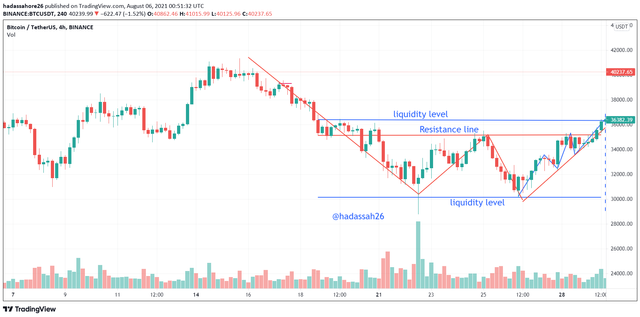
Here we have seen price from a higher time frame, price was actually previously in a downtrend but is makeong a strong reversal. We can now see an incumbent BRB structure forming, with price breaking a resistance line and currently retesting it.
We wait on watching our lower time frame. We can now see that price has trended back up, and now broken the previous resistance break now liquidity level.
We place a buy order setting our stop loss and take profit properly.
”4. Draw Liquidity levels trade setups on 4 Crypto Assets (Clear Charts Needed)”
For this exercise, I will be splitting the setup tasks into 2, first two trades on past market quotes, and next two for current quotes.
Secondly I will be using the Market Structure Break Strategy and Break Retest Break strategy for the first two trades, then introducing two methods we could also use to detect next price direction, they are the:
- General trend + over sold or over bought strategy
- Elliot wave theory
First Setup
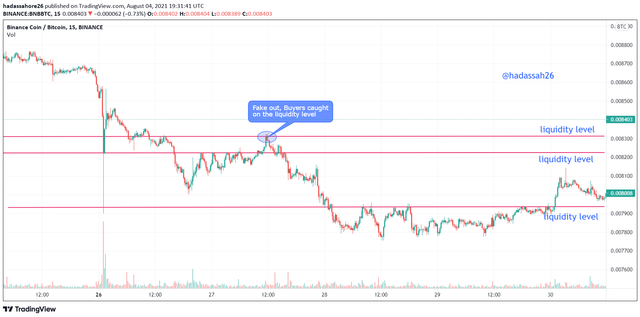
From the above chart, as the market hits liquidity level, we get patient awaiting it to retrace and trend back up to know what next. it soon forms a lower high signifying a Market Structure Break strategy.
We draw our neckline and await it to break it. Price soon breaks the neckline and we are sure of our Market Structure Break Strategy.
we can now place a Short position setting desired stop loss and take profit.
Second Setup
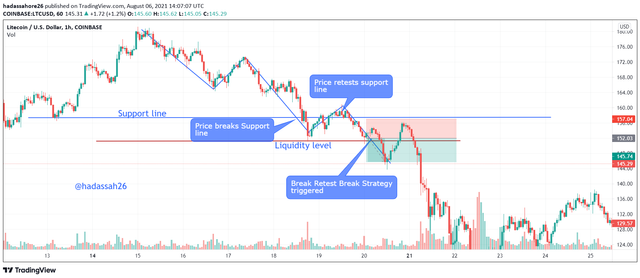
The chart above shows a downward market structure, we watch the liquidity level, price hitting it, we wait incase of a retracement. With the retracement, we see price is retesting in previous broken support line now a resistance line to it.
A BRB strategy is imminent, we wait for price to break its previous liquidity level and take a short position here.
Third Setup (Using General trend)
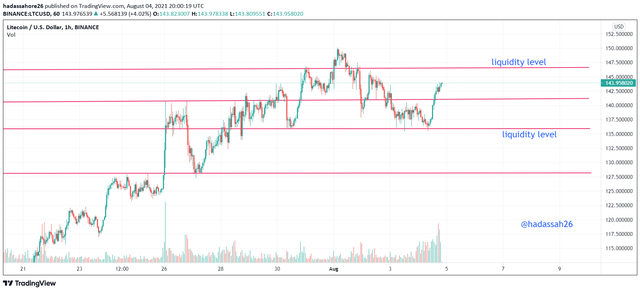
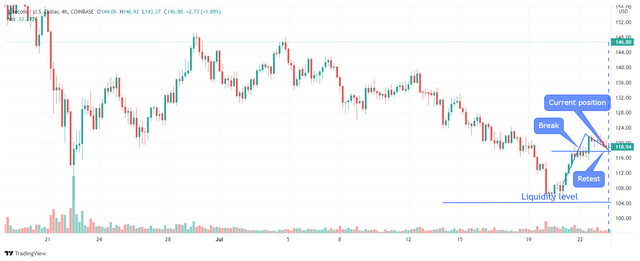
Looking at the above chart above, price is on a realtime quote, but more price is seeming very lonely, and traders may not have an idea of where next it may go, we draw our liquidity lines and watch.
Now we draw a trend line and find out price was formerly in a downtrend, this is a clue of some downward retracement of price, we can now confirm from a higher timeframe.
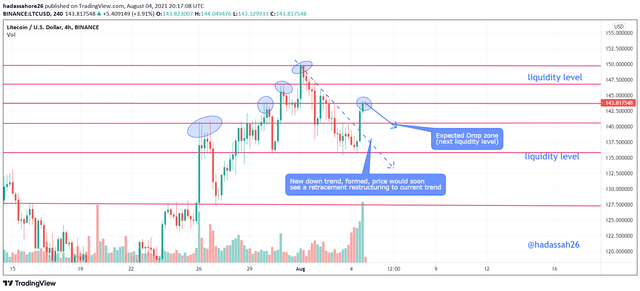
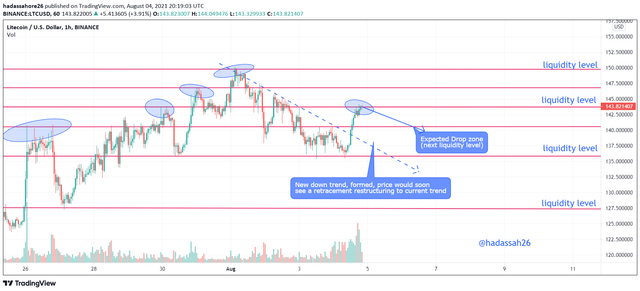
Confirming from a higher timeframe, we see that yes price is currently on a down trend and even currently on a liquidity level. we can now see that price may soon be hitting is former resistance now support point.
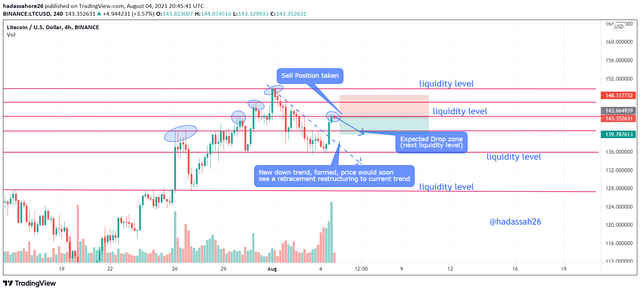
We can now take a short position setting our stop loss and take profit with a good risk to reward ratio.
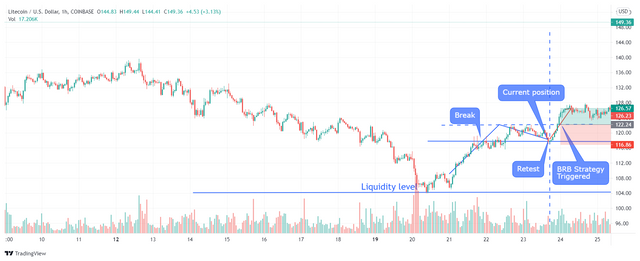
Forth Setup (Using Elliot wave pattern)
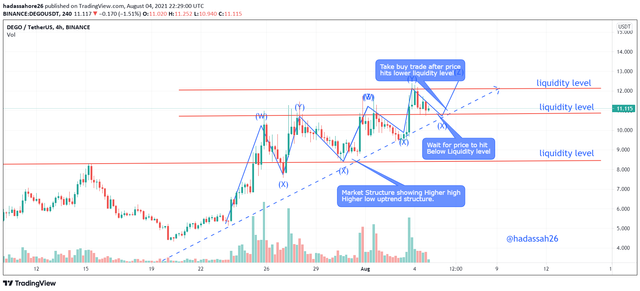
Looking at the above price and chart, we see price is following an uptrend Elliot wave pattern( this can also be used for Break Retest Break strategy),
We draw our trend line and wait for price to hit it, price hitting the trend line we can now place a buy trade and setting our stop loss and take profit.
From this article, we have seen that Liquidity levels are Decision Levels and retail traders should not be rash to take decisions as they could be prey to institution money players.
Retail traders should rather watch Price momentum and market structure by also viewing the market from a higher timeframe.
After checking for price momentum and market structure, retail traders can now choose between either the Market Structure MSB or Break Retest Break BRB strategies to make profitable trades.
Thanks
CC:
@cryptokraze.