Crypto Academy / Season 3 / Week 4 - Homework Post for @cryptokraze | Trading The Dynamic Support & Resistance
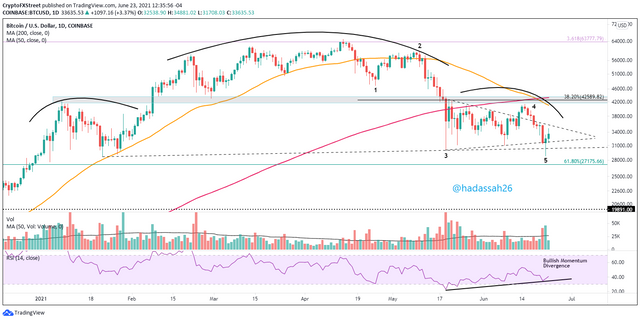
Price moves in a constant up-down fluctuation, both on shorter and longer periods. With a general picture as shown below:
This then makes the idea of price fluctuation on higher timeframes make sense. Traders with constantly changing perception of market direction at different timeframes influencing the market.
How then do we make profitable trades on this ever fluctuating market?
From previous discussions we have come to know that price mostly bounces off on places it had retraced previously. This which is explained as due to the caution exercised by traders on price hitting previous higher highs (on uptrends) and lower lows (on downtrends) may now bring the thought of it being over or under valued making traders either pull out some of their holding during higher highs or put more holdings during lower lows causing the terms: Resistance (retracement at higher high) and Support (retracement at lower low).
Good day beautiful Steemians, I am @hadassah26, welcome to my week 4 Season 3 homework for professor @cryptoKraze on: Trading The Dynamic Support & Resistance

”1. What do you understand about the Concept of Dynamic Support and Resistance? Give Chart Examples from Crypto Assets. (Clear Charts Needed) “
Dynamic Support and Resistance is the act of price retracing or rebounding as it goes along a certain path. This which can now be tracked with indicators ranging from EMAs, Ichimoku Uno, MACD etc, and tradable with trading strategies such as the finger trap trading strategy.
Understanding that price has a dynamic support and resistance level is key to profitable trading.
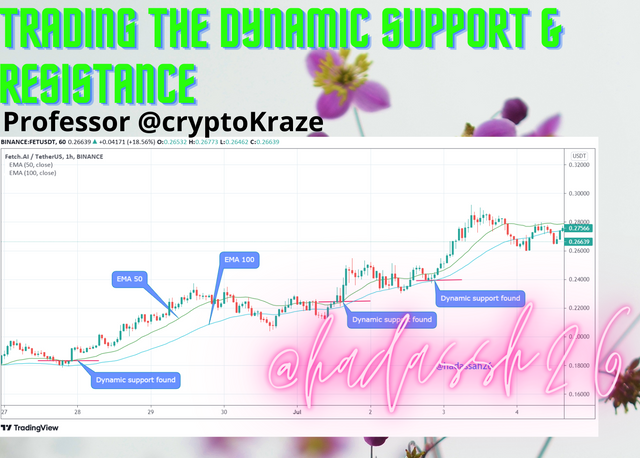
Dynamic Support Levels:
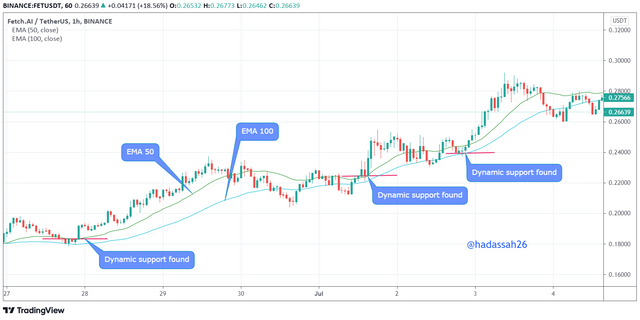
In the chart above, we can see that with price in an uptrend when it retraces downwards the EMAs act as dynamic support levels rebounding price back upward to continue on the trend.
Dynamic Resistance Levels
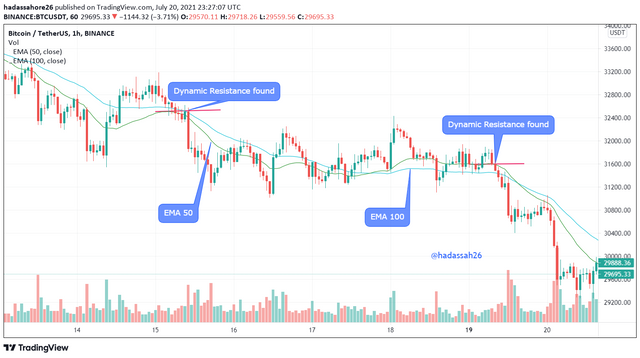
In the chart above we can see that with price in a down trend, it makes retracements tending upwards when it goes and reaches the EMAs it finds resistance at that level and then retraces back down continuing on the bearish trend.
”2. Make a combination of Two different EMAs other than 50 and 100 and show them on Crypto charts as Support and Resistance. (Clear Charts Needed)“
Choosing the right EMA indicator for dynamic Support and Resistance involves some level of experience. This experience which is understanding the Volatility of the market, the Time Frame that gives a better synchronization and your Risk level/Capital.
For this exercise I will be choosing the 45 and 90 EMA for the TetherUS/NGN and BTC/TetherUS Cryptocurrency pairs because:
- The EMA is a good trailing indicator so it will be a good dynamic support and resistance indicator
- The 45 and 90 EMA synchronizes well with the chosen currency pairs volatility and selected time frames.
How to Add the EMA on Tradingview:
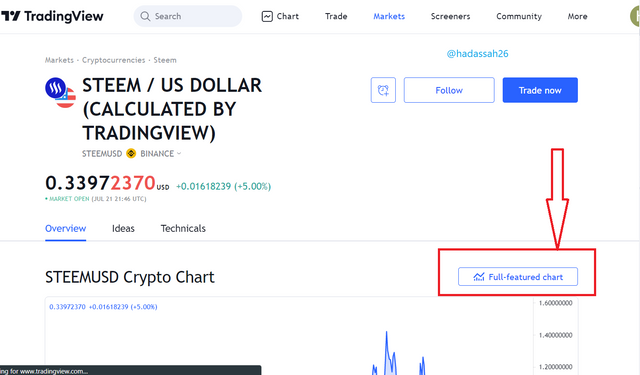
To add the EMA to trading view, we first select our chart(View full chart):
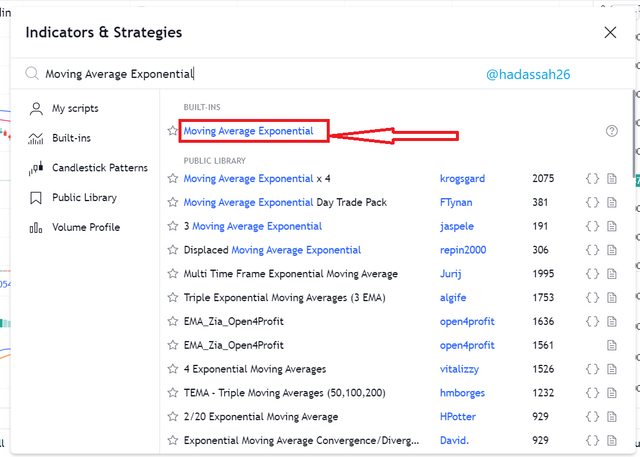
Now we click on indicators and type in: “Moving Average Exponential” and select it.
We set the period to 45 and set the colour style.
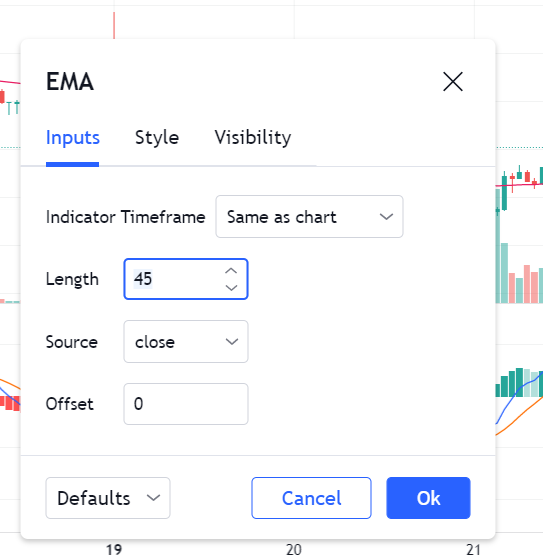
We repeat the process setting the period now to 90 and changing our colour style .
Dynamic Support using the 45 and 90 EMA:
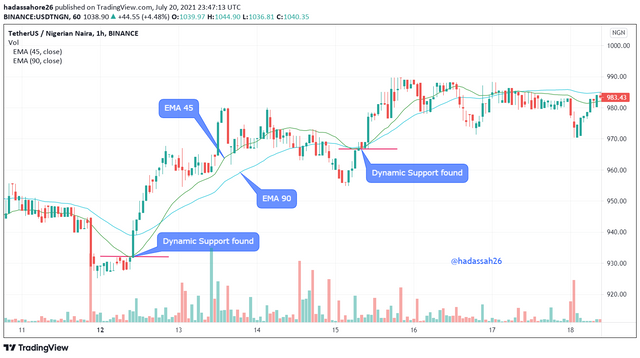
We can see that retracement points of support properly fall in place touching the EMA 45 and 90. Price respects these dynamic support points and bounces back up at those points continuing on the uptrend.
Dynamic Resistance using the 45 and 90 EMA:
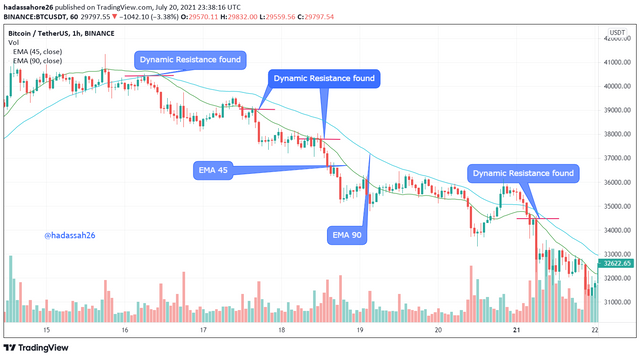
Here again we can see that price respects the EMAs 45 and 90 as it is in a downtrend, retracing back down when it touches them.
”3. Explain Trade Entry and Exit Criteria for both Buy and Sell Positions using dynamic support and resistance on any Crypto Asset using any time frame of your choice (Clear Charts Needed)”
Entering a trade or exiting one with the EMA for dynamic support and resistance can be tricky since you might be having the FOMO when faced with a fast moving market. To help ease the choice of entry, we can use oscillatory indicators to view over sold or over bought positions especially the MACD indicator.
From question 2, we can see the EMA works well with dynamic support and resistance, now choosing great entry and exit points, we can get assistance using the MACD as shown below:
Resistance Entry Trade Criteria Using the EMA (50,100) and MACD
Setting our EMA and MACD we now watch for the current trend of price.
• Noticing a trend with the gradient of our EMA we can now tell if we are watching for resistance or support. (Resistance causing price in downtrend, retracing upwards to retrace back down and continue in trend. Support causes price in uptrend, retracing downwards to retrace back up and continue in trend.)
• Finding a bearish trend, we look for possible positions with retracement. Here our oscillator comes in play. Watching our oscillator for over sold or over bought signals or divergences against the trend.
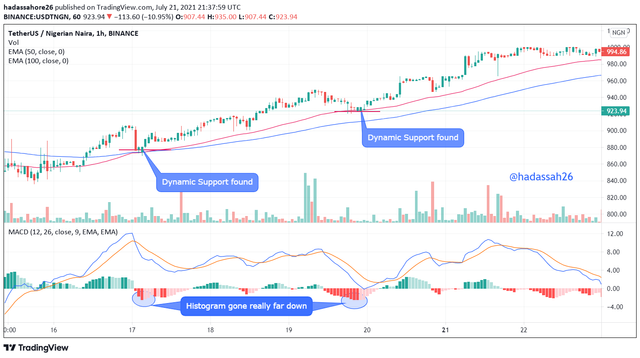
Looking at the chart below, we can see that at points “a” and “b”, the price finds dynamic resistance after touching the EMA 50.
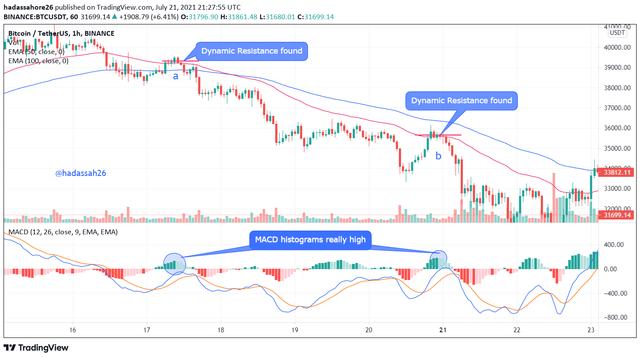
But if you noticed down at the MACD, you would notice that the green histogram had gone really far up relatively already signifying price retracement weakness.
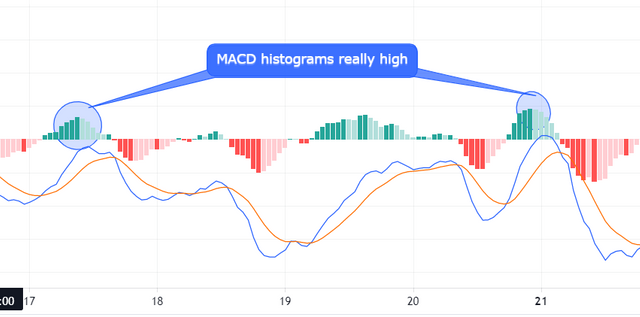
This way we could have known already of price retracement coming to an end and already getting ready for our EMA resistance signal to place our sell entries.
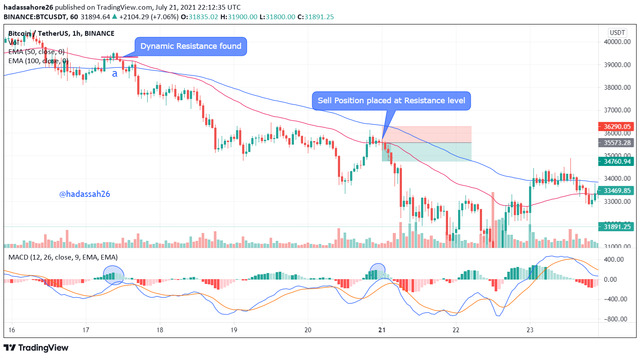
• Now with full confirmation of our dynamic resistance, we place our Sell entries hoping to make profit.
Support Entry Trade Criteria Using the EMA (50,100) and MACD
Same procedure as our buy entry criteria but on the inverse:
• We watch our EMA for a good bearish gradient. On noticing a good bullish gradient, we watch for support zones(price retracing downwards).
• Here we watch our MACD for divergences or over sold positions(mostly with our histograms).
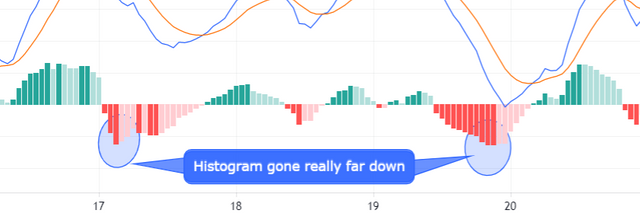
• On noticing the coming of the end of the incumbent retracement, we can now look out for price hitting our EMAs. (some times price may not really touch the EMAs, or also go past the EMAs that is why we need our MACD to tell us they mean the same thing
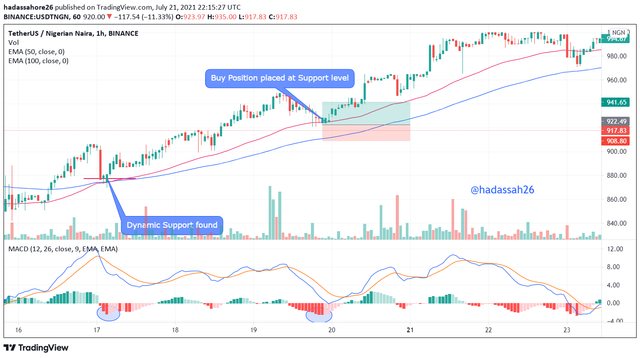
• On confirmation of dynamic support we can now place our buy trades expecting profit.
Exit Criteria for Support Positions:
Exit criteria for buy Positions can either be for take profit(when in profit) or stop loss(when in loss).
• On every buy trade using Dynamic EMA 50,100 Support and Resistance strategy, I place my stop loss at the 100 EMA below the Support level to mitigate losses.
• I place my take profit at 1:1 (Risk to Reward) RATIO to avoid Greed and price retracing back down causing me to close trade in fear accumulating loss.
Exit Criteria for Resistance Positions:
• On every sell trade using Dynamic EMA 50,100 Support and Resistance strategy, we place our stop loss at the 100 EMA above the Resistance level to mitigate losses.
• I place out take profit at 1:1 (Risk to Reward) RATIO to avoid Greed and price retracing back down causing me to close trade in fear accumulating loss.
"4. Place 2 demo trades on crypto assets using Dynamic Support and Resistance strategy. You can use lower timeframe for these demo trades (Clear Charts and Actual Trades Needed)"
Understanding how to use properly my dynamic resistance and support, I will be placing two demo trades with hopes of making profit.
For this trades I will be using my Metatrader 5 since I am very conversant with it, and it allows me demo trades easily.
First Trade:
Here I watch the ETHUSD trend upwards looking for a retracement to trade on the next bull run when it hits my EMA.
It hits the EMA at 1991 USD and I wait a little then enter the trade at Price 1992.96
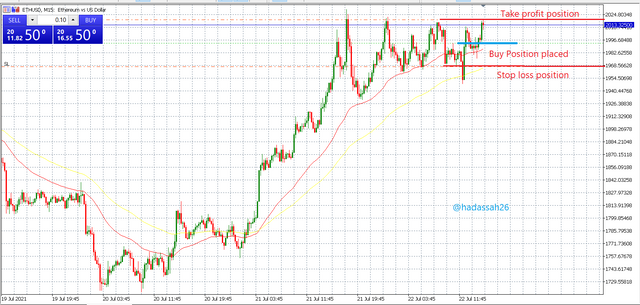
I set my stop loss at 1967.24 and take profit at 2019.09 with a (1:1) Risk to Reward ratio
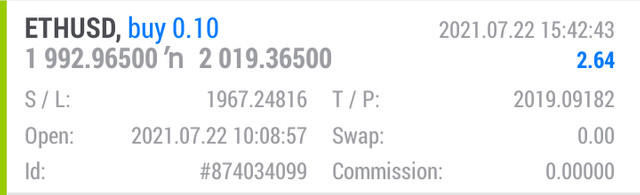
Trade Data
Price:1992.96
Take Profit:2019.09
Stop loss:1967.24
Second Trade
Here I watch the BNBUSD trend losing momentum, giving us a head and shoulder formation. I wait for a resistance when it hits my EMA.
It hits the EMA at 294.70 USD and I wait a little then enter the trade at Price 294.331
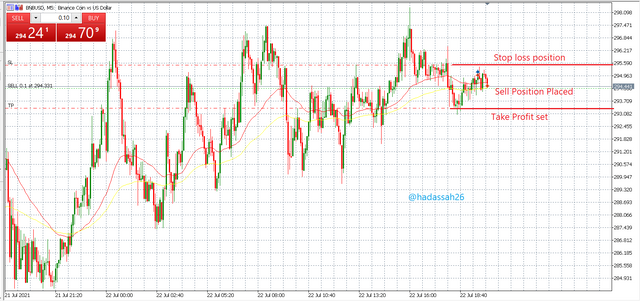
I set my stop loss at 295.49 and take profit at 293.35 with a (1:1) Risk to Reward ratio
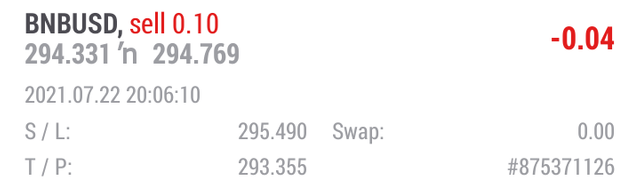
Trade Data
Price:294.31
Take Profit:293.35
Stop loss:295.49
Knowledge of Dynamic Support and Resistance is very important to trading as price trends do not have to go back up to test static support and resistance.
The theory is the same, traders get scared when price over sells or over buys. This makes them pull out some holdings making price retrace. Price retraces hitting Resistance(when in a down trend) or Support(when in an uptrend). Traders now think price is undervalued and buy in again causing price to jump back to its initial trend direction continuing on the trend.
Thanks.
CC @cryptokraze
Dear @hadassah26
Thank you for participating in Steemit Crypto Academy Season 03 and making efforts to complete the homework task. You got 8.5/10 Grade Points according to the following Scale;
Key Notes:
*.You have shown good understanding of the strategy by making precise charts for different elements of the strategy.
We appreciate your efforts in Crypto academy and look forward for your next homework tasks.
Regards
@cryptokraze