Crypto Academy - Season 3 - Week 3 - Homework Post for @cryptokraze | Break Retest Break (BRB) Strategy to Trade Continuation
During my early days of forex trading, I stumbled upon a very beautiful book by FXTM head of education boss, Andreas Thalassinos named “50 Successful Traders Habit” link.
Some major points I learnt from this book were:
“The trend is your friend”
”Price always breaks support and resistance levels”
These two rules which very much apply to todays discourse explain why “Price is boss” and we only should find strategies that empirically synchronize with price rather than trying to restrict price to our resistance and support levels causing emotional trading.
Good day beautiful Steemians, I am @hadasah welcome to my SteemitCrypto Academy season 3, week 3 homework for professor @cryptokraze on: Break Retest Break (BRB) Strategy to Trade Continuation.

”1. What do you understand about the Concept of Break Retest Break Strategy? Give Chart Examples from Crypto Assets.”
Break Retest Break strategy in one sentence is “a concept of trading strong market trends after pull backs.”
When market is in a strong trend, (either bullish or bearish) it breaks its immediate support or resistance level as discussed last week, causing a new higher high or lower low depending on its direction. With new fear gained by traders, market sees a pullback taking it to the initially broken support or resistance. Traders now take advantage of the new position, price soon reverses to the initial trend direction, now market has gained a new momentum breaking its previous swing high or low and making a new one.
With the break retest break strategy, we can now trade on this new momentum gained by the market taking pips till its new swing position.
From my introduction about price breaking resistance and support, and the trend being our friend, the market Break Retest Break strategy takes these into cognizance and tries to follow price pattern during a strong trend making profit.
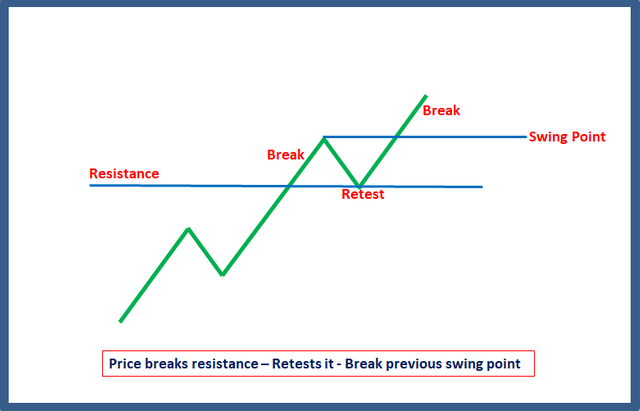
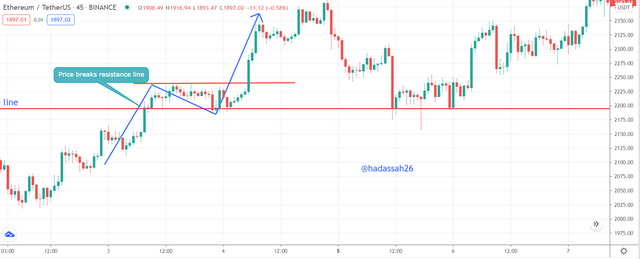
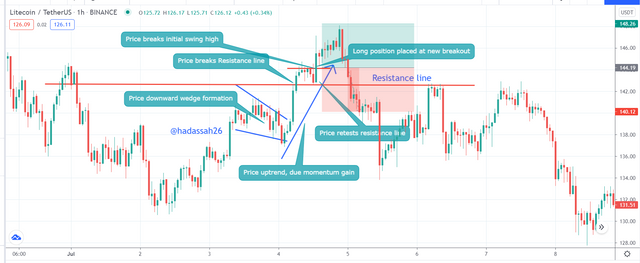
We can see price following a bullish market structure and breaking the resistance line forming a swing high. Retracing and retesting the resistance line, then making a U turn a new bullish rally, breaking its initial swing high and forming a new swing high.
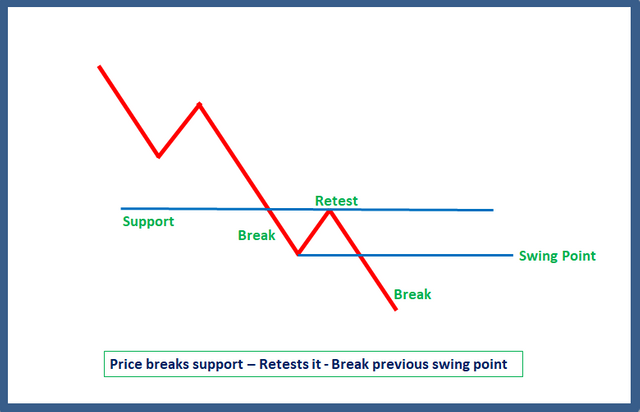
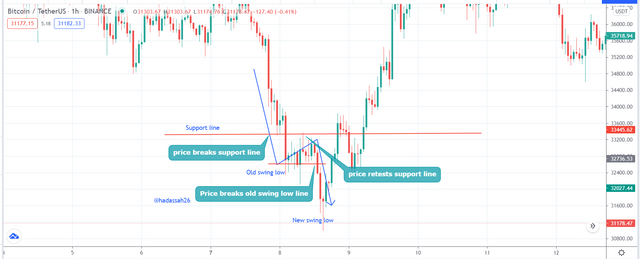
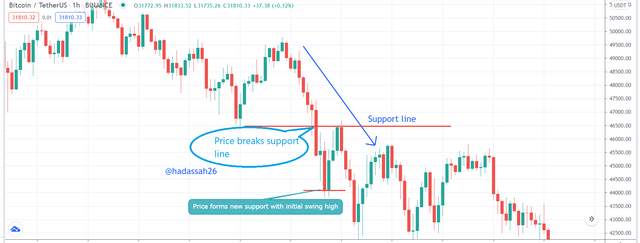
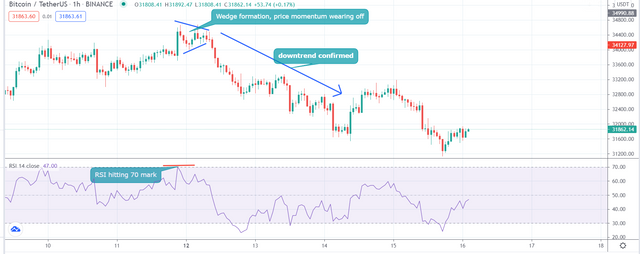
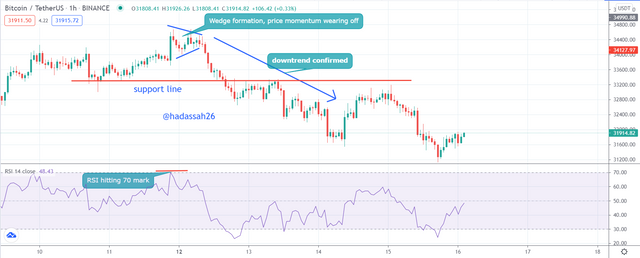
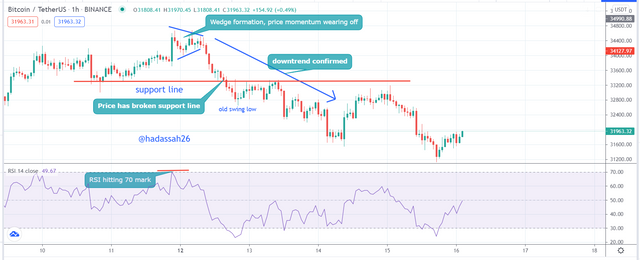
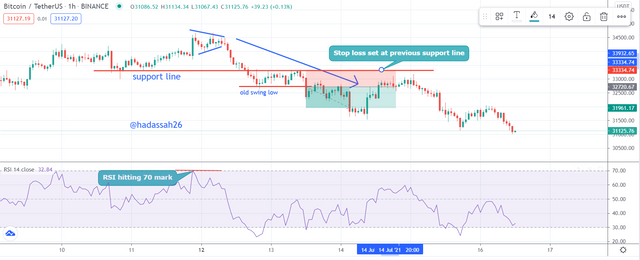
We can see price sloping down a bearish market structure, breaking the support line, forming a swing low, then retracing back to the support line and retesting it. Forging down back again, breaking its initial swing low and creating a new one.
Market Break Retest Break strategy has some advantages and disadvantages compared to other strategies like the Market Structure Break strategy, Finger trap strategy etc..
• The Break Retest Break strategy unlike the Market Structure Break strategy is more frequent to spot on market trends.
• The Break Retest Break strategy works well on any timeframe as far the trend is strong.
• Easy for price to consolidate after breakout, mistaking point of consolidation with Break Structure Break strategy.
”2. Mark important levels on Crypto Charts to trade BRB strategy. Do it for Both Buy and Sell Scenario.”
Before going on with this question I want to address a very basic concept and how to identify it.
From the definitions of our strategies we see that support and resistance are the underlying foundations so we have to know about them .
Support and resistance levels are basically places where price has either hit before with a probability of repeating itself at these regions, or empirically calculated zones where traders expect price to hit, such as the pivot point lines or Fibonacci retracement lines.
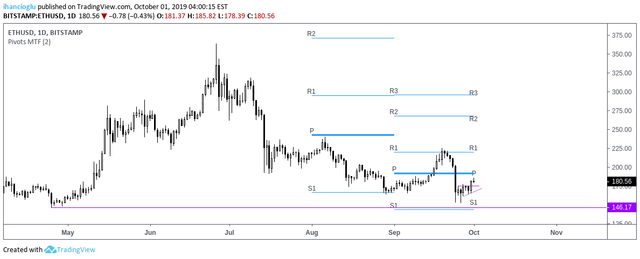
Pivot points, Picture from source
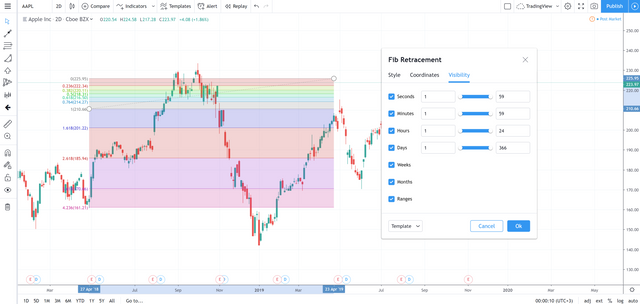
Fibonacci, Picture from source
From the above charts with the resistance and support lines spanning through the chart, we see that when bullish price hits the resistance line, it tends to retrace down ward and when bearish price hits the support line, it tends to move back down.
Now with at least understanding support and resistance lines we can now proceed to the question.
To mark important levels to trade Break Retest Break strategy, we first draw our support and resistance (this which professionally we can detect the closest to our current price).
For Buy trades:
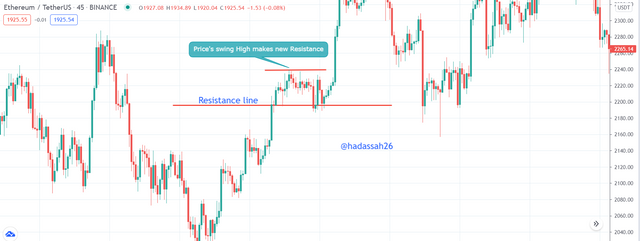
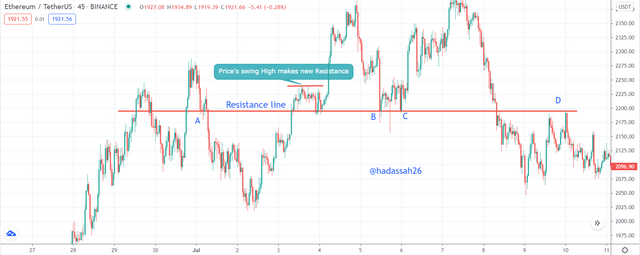
Below we can see how the resistance line affects price spanning through the chart, causing retracement at "A","B","C" and "D".
For Sell trades:
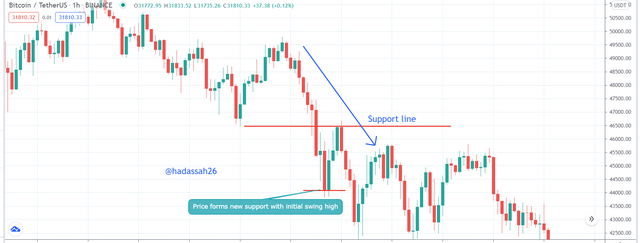
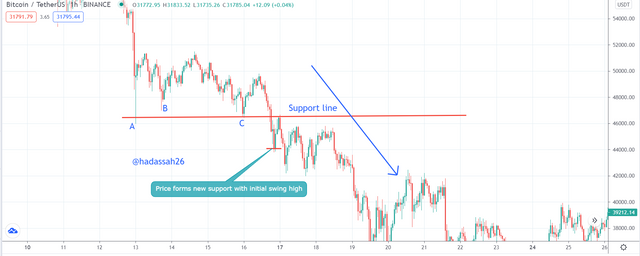
Below we can see how the support line affects other price through the chart causing retracements at "A","B" and "C".
With price in a strong trend, it breaks through either the resistance (uptrend) or support(downtrend). Picture below:
Price now makes a new swing high (uptrend) or swing low (down trend) at “a” and soon starts retracing to the resistance now support line (for uptrends), or support now resistance line (for downtrends) at “b”. price kisses it and then starts a new run, breaking its previous swing position. This is where we get in, at “c”, following price till it makes its next swing position.
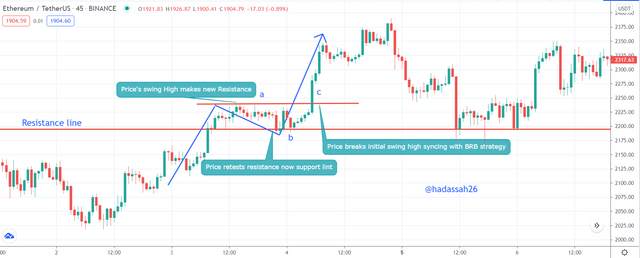
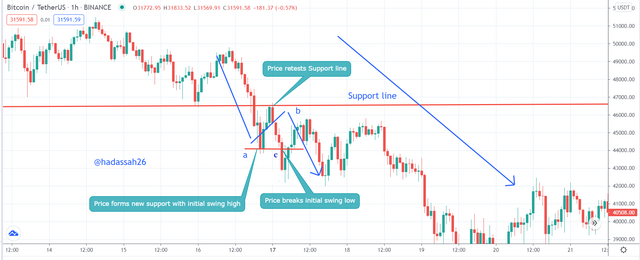
The Marked point at “c” is where we trade our Break Retest Break strategy.
”3. Explain Trade Entry and Exit Criteria for both Buy and Sell Positions on any Crypto Asset using any time frame of your choice”
Like every other trading strategy, the Break Retest Break strategy is to make profit. Here working with price momentum due to strong trend we are trying to be in front of the price momentum hoping to follow price till its next swing position.
So let us go over the rules of this strategy:
Buy Entry Criteria Using Break Retest Break Strategy:
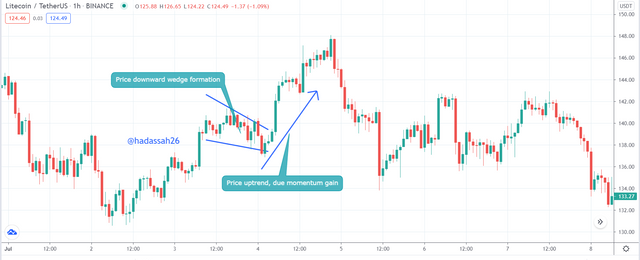
• First we look for a strong Up trend.
This which we can identify by price action and use of indicators. Examples are:
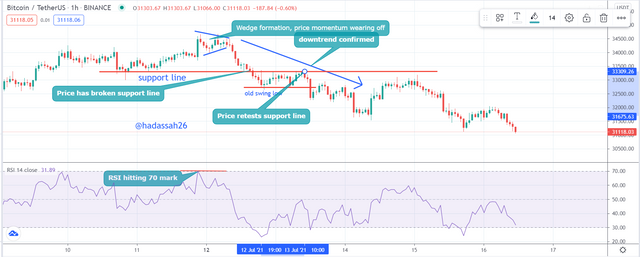
i. After a wedge formation or price/indicator divergence.
ii. Continuation of a trend following a trend line.
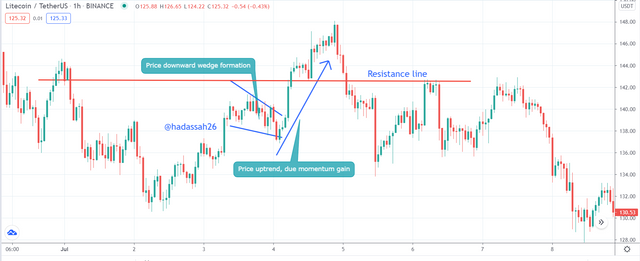
• Secondly we mark Resistance and Support lines. (These we can draw as explained above in question 2).
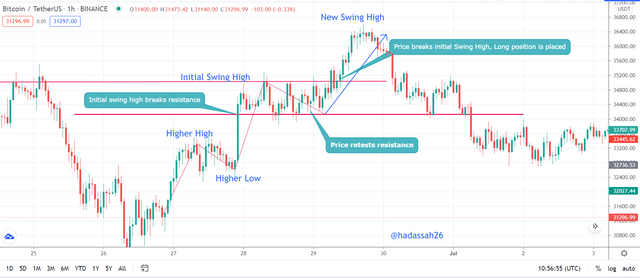
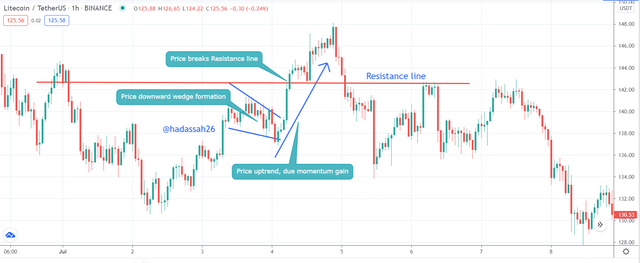
• With market resistance and support lines we check if price has broken any resistance line recently with its trend, made a swing high and now having a pull back.
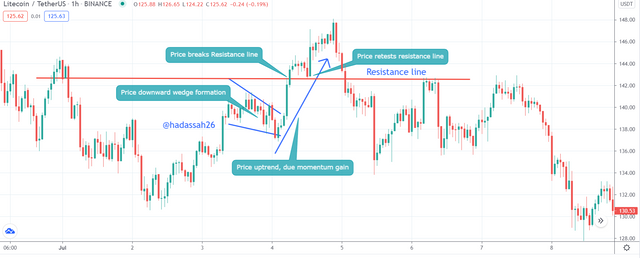
• If yes to number 3 above (as in chart above) we await price to retest the resistance line then climb back up.(as shown in chart below).
• With price going as expected, if price breaks the previous swing high, our strategy is now in sync. We now place a Buy entry just above the previous swing high.
Sell Entry Criteria Using Break Retest Break Strategy:
• Here we same, look for a strong down trend, identifying it with either a trend line or a reversal price pattern.
• Then we mark our Support and Resistance lines.
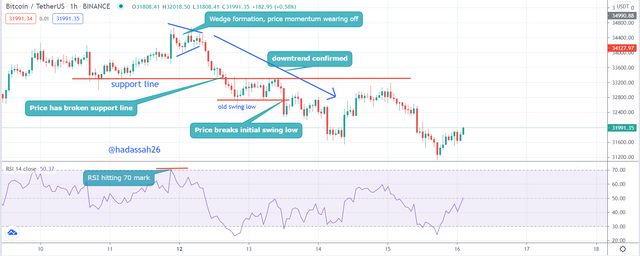
• With marked resistance and support lines we check if price has broken such lines recently and made a swing low, then pulled back.
• If price has done as expected in number 3 above, we await price to retest the support line then slump back down(as shown in chart below).
• With price going as expected, if price breaks this previous swing low, our strategy is 80% complete.
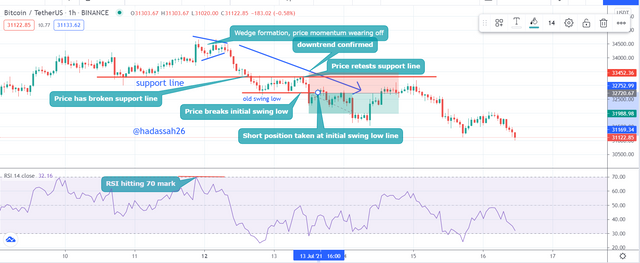
• We now place a Sell entry order just below the previous swing low.
Exit Criteria are either if trade goes positive or negative. Any ways we either try to mitigate loss or take profit. Since both buy and sell exits are similar, we will be taking them together. We will be taking exit criteria for in profit and in loss.
When in profit:
• With price breaking previous swing high, we set our long position at a risk and reward ratio of (1:1). Setting ourTake profit to be at the next swing high.
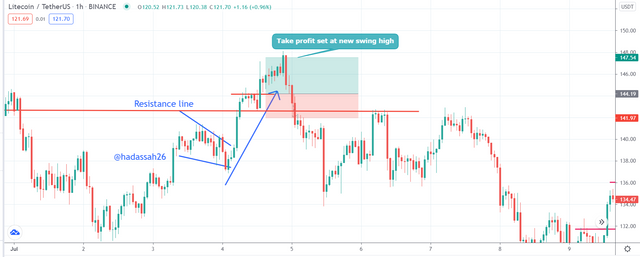
• When price hits that position, we take profit and close trade.
When in Loss
• Setting our position, we also try to mitigate loss incase of price U turn. We set our Stop loss at the initial Support point.
• If price goes wrong, hitting that point, our trade closes automatically saving us more loss.
"4. Place 2 demo trades on crypto assets using BRB Strategy. You can use lower timeframe for these demo trades (Screenshots Needed)
"
In taking my trades, I will be using lower timeframes and my mobile device since I have a submission time constraint, and need to be checking up continuously on trades.
After much waiting, I see the BNB, and LTC charts have same sell structure for Break Retest Break strategy. So I trade both of them for this homework.
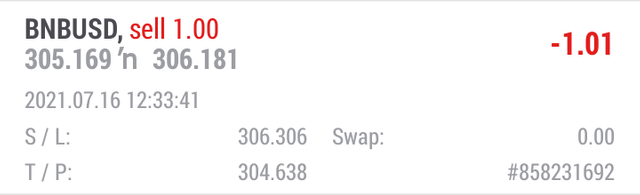
First Trade
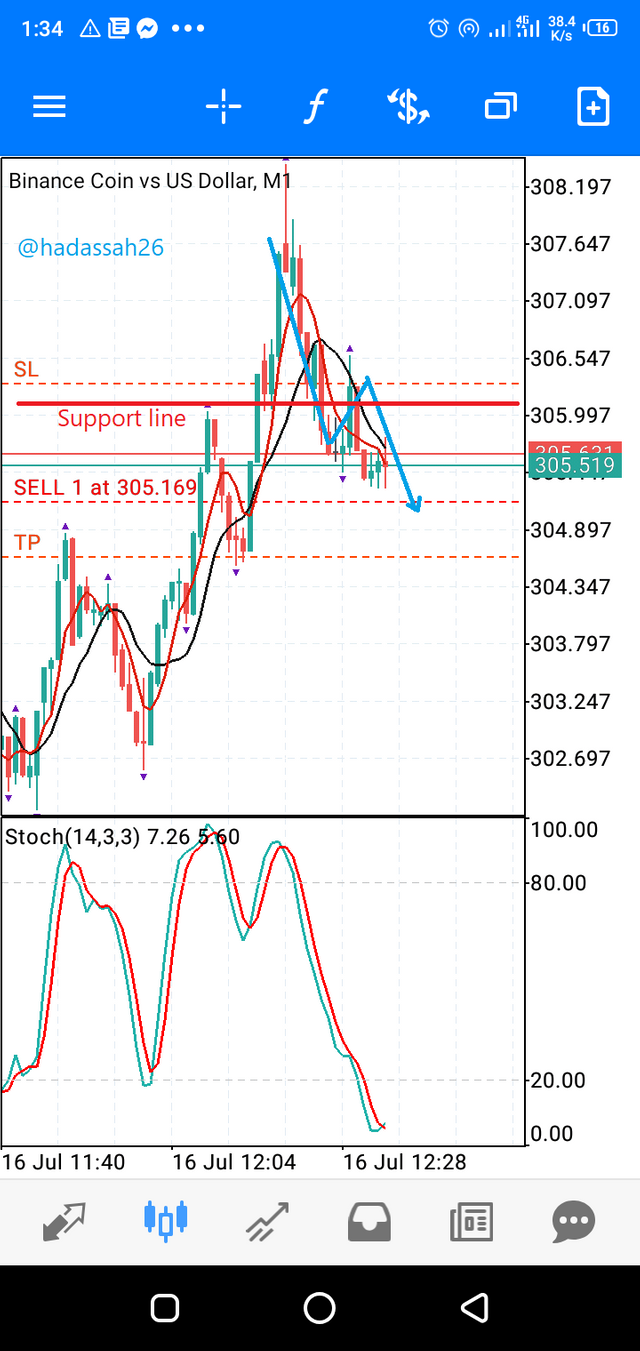
I take the trade at 305.519 and set my stop loss at 306.306 and take profit at 304.638.
Trade Data:
Price: 305.519
Stop loss: 306.306
Take profit: 304.638
Second Trade
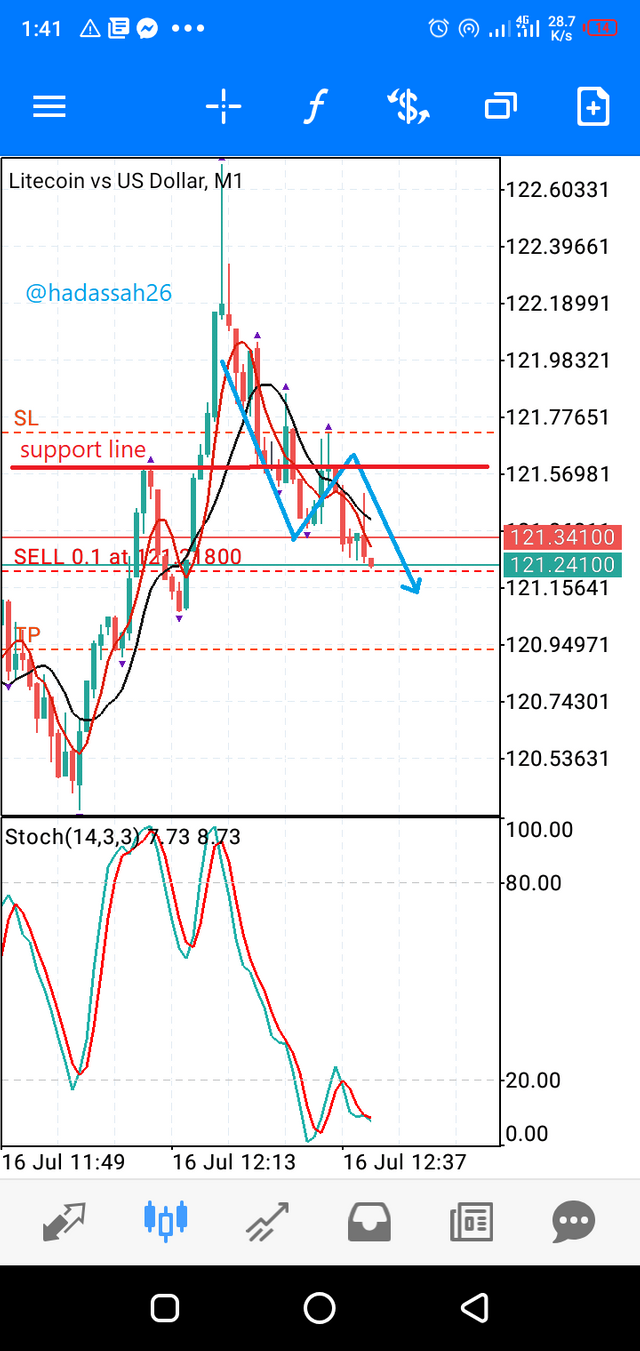
I take the trade at price 121.218 and set a stop loss at 121.722 and take profit at 120.936.
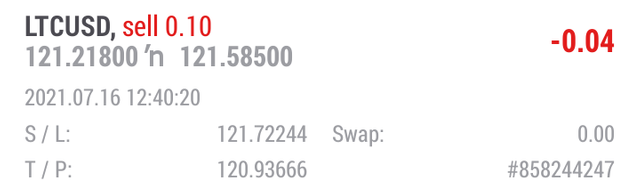
Trade Data
Price: 121.218
Stop loss: 121.722
Take profit: 120.936
Price is boss, we shouldn't try limiting price to our own resistance and support.
The Break Retest Break strategy is a great strategy for trading on price momentum and trends.
Indicators can be used to check or confirm trends if necessary, but price action they say sometimes is enough.
Thanks. @cryptokraze
Dear @hadassah26
Thank you for participating in Steemit Crypto Academy Season 03 and making efforts to complete the homework task. You got 6.5/10 Grade Points according to the following Scale;
Key Notes:
We appreciate your efforts in Crypto academy and look forward for your next homework tasks.
Regards
@cryptokraze