Crypto Academy - Season 3 - Week 2 - Homework Post for professor @yohan2on Homework by @hadassah26
Price fluctuates vertically due to traders sentiment and general change in market value, the Fibonacci sequence developed as a mathematical function of sequences had been developed by Leonardo Fibonacci, now adopted by financial analysts due to its regular synchronization to market demand and supply zones is used to track these price fluctuations and make better trade entries.
Good day beautiful Steemians, I am @hadassah26 welcome to my week 2 season 2 homework of the Steemitcrypto academy lecture by professor @yohan2on on: Trading with the Fibonacci Retracement levels
”1. What are Fibonacci Retracement levels?”
Fibonacci retracement levels are lines projected from the use of the Fibonacci retracement formula that tend to correspond with retracement swing points, or rather resistance and support points of the market.
The Fibonacci retracement formula which is a gotten from the Fibonacci sequence of adding a number to the previous two numbers before it in the sequence starting from 1 in ascending order such that 0+1=1, 1+1=2, 2+1+0=3, 3+2=5, 5+3= 8, ……… ,(X’)+X = Y
Mathematics
From the end of the above sequence, we see that, for any number in the Fibonacci sequence, say X, and the number before it in the sequence say X’ then the sum is equal to X+X’=Y.
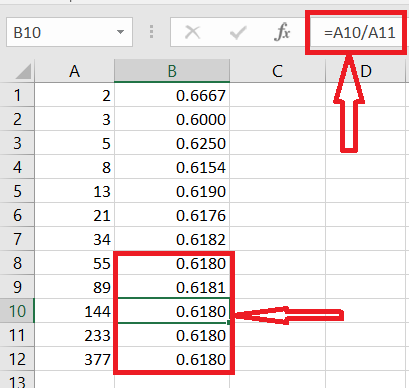
Now if we divided X by its succeeding number in the sequence we get, an number around 0.618, we can confirm this by doing a simple simulation with excel, taking the Fibonacci numbers 2,3,5,8,13,21,34…. And divide them by their succeeding numbers.
The Fibonacci levels are now gotten from dividing a number in the sequence by multiple count succeeding numbers in the sequence, giving the 32.5, 23.6 etc levels.
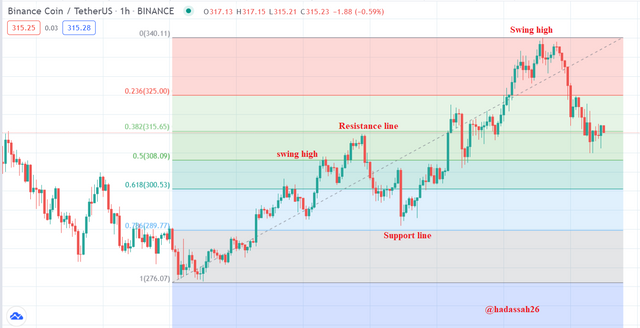
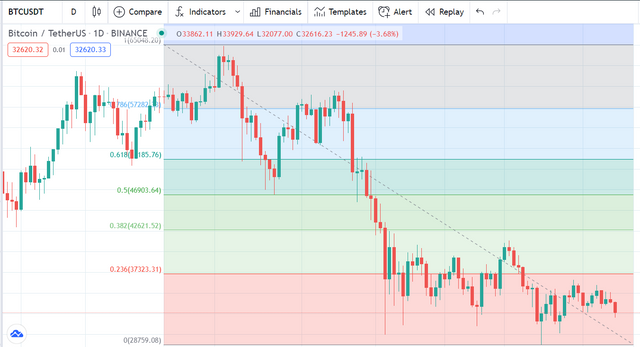
Drawing these levels on the chart gives the diagram as shown below.
The Fibonacci Retracement Tool on TradingView
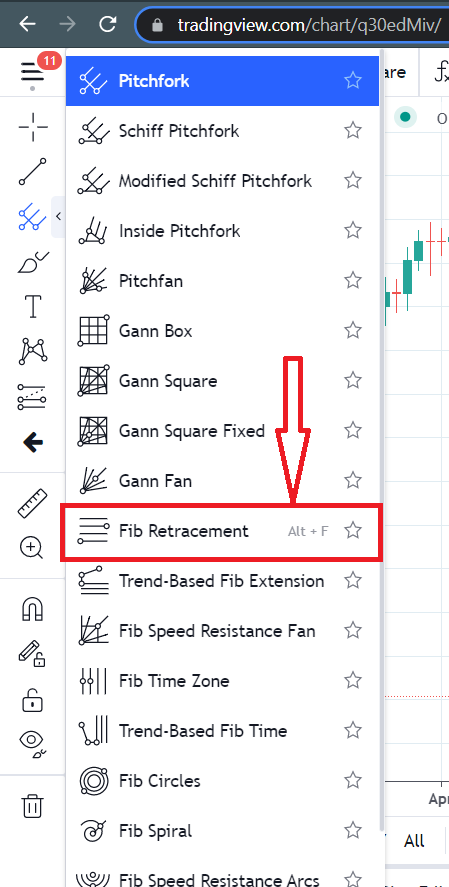
To use the Fibonacci retracement tool, we open our trading view with selected chart and double click on the pitchfork icon by the left of the screen.
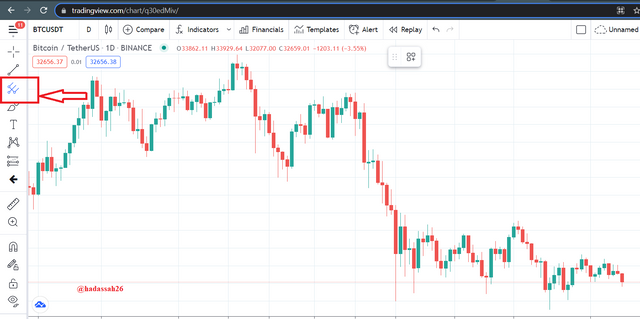
We select Fibonacci retracement from the list of tools
Now we can draw our Fibonacci retracement.
Plotting the Fibonacci on Chart
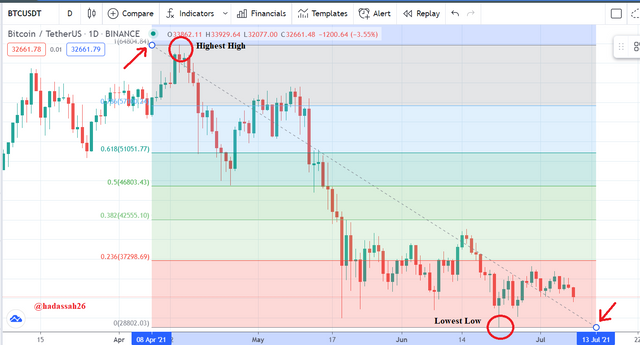
To plot the Fibonacci retracement on the chart, we look for the highest swing high and swing low.
We take any of these points were we place our pointer, click and hold the right mouse button, then hold and drag to the other swing point. The Fibonacci tool now draws lines which mostly correspond with our resistance and support points.
Uptrend Analysis
In uptrends the Fibonacci retracement finds higher lows which are points of retracement and possible re-entry points.
In the chart below, we can see the 61.8% Fibonacci line making two support(retracement) points at “a” and “b”. the 38.2% Fibonacci level forms other support points at “c” and “d”.
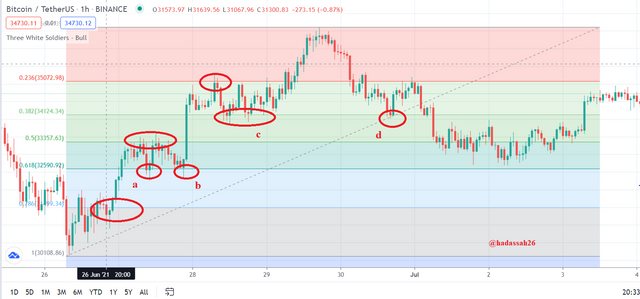
These become possible buy re-entry points.
Downtrend Analysis
In downtrends, the Fibonacci retracement finds lower highs (resistance) points being possible retracement points.
In the chart below, we can see the 61.8% Fibonacci line forming resistance at “a” and “b”. and the 23.6% Fibonacci forming a general resistance and support line spanning through the chart forming various resistance points.
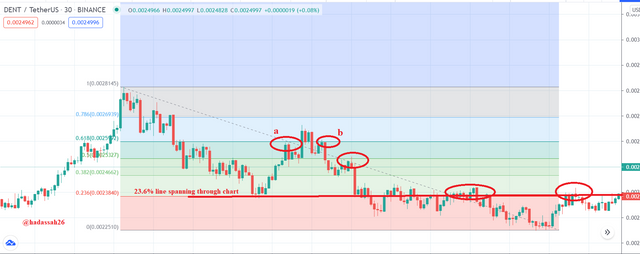
These become possible sell re-entry points.
Entry and Exit Strategy Using the Fibonacci and an indicator
With the above price action chart I am going to explain how to enter and exit using the Fibonacci and an indicator.
From the chart we see price was previously in an uptrend with Fibonacci levels drawing resistance and support points at “a”, “b” and "c"
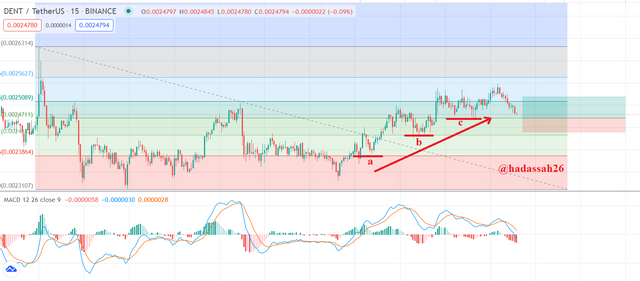
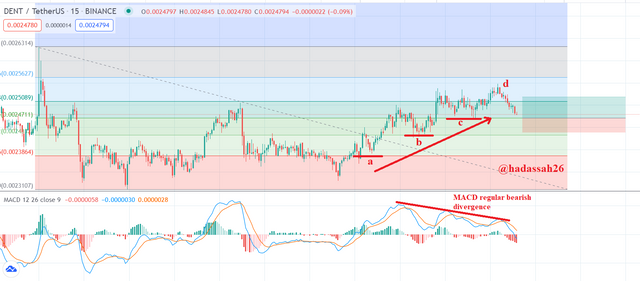
Price has now lost its momentum from at “d” as signaled in our MACD divergence with the chart (Regular Bearish divergence). We are now seeing a current bearish retracement.
Since price was in an uptrend, I suspect a retracement after this bearish retracement, at “e” the 50% Fibonacci retracement level.
I confirm this by looking at my MACD indicator and see its histogram has gone really far down, and an expected retracement is imminent. I place a long position at the 50% Fibonacci line.
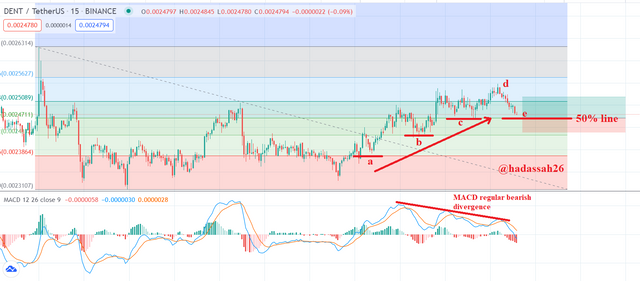
I though set my Stop loss in case of negative price movement at the previous support point, and Take Profit at a little above the 61.8% Fibonacci point giving a (1:1.5) Risk to Reward ratio.
Key Entry Strategy
- Make sure price is in a current strong trend before drawing fibonacci levels
- Draw fibonacci levels properly from highest high to lowest low
- Watch for possible trade entries through retracement that have formed on tested fibonacci resistance or support levels
Key Exit Strategy
- Set two exit strategies, one incase of possible trade, (Take Profit), the other for negative trade (Stop loss).
- Do not be greedy with take profits, a (1:1) to (1:1.5) is a good enough risk to reward ratio.
- Stop losses should be set with enough allowance for irregular market fluctuations

The Fibonacci retracement has shown to be a great tool in trading for finding possible retracement and support points. Maybe market also behaves like nature going in Fibonacci sequences.
Using the Fibonacci retracement should involve confirming with proper price action and a understandable technical indicator.
Thanks.
CC @yohan2on
Hi @hadassah26
Thanks for participating in the Steemit Crypto Academy
Feedback
This is good work. Glad to see that you were able to plot the Fibonacci retracement levels on the charts using the two identified and chosen price points though when it came to trading using the Fib levels you traded the support and resistance lines that were demarcated by the retracement levels. There was a lot more needed in your work. Otherwise great effort and nice content presentation.
Homework task
7