Crypto Academy - Season 3 - Week 2 - Homework Post for professor @cryptokraze homework by @hadassah26
Greed and fear, demand and supply, buyers and sellers. Understanding these two sides of trading gives the foundation of market structure and analysis. But how do you talk about them without first treating “Value” and then “Price”.
Value should be equivalent to price, but hold on let me explain a little bit further on value.
Value is defined as the usefulness of something source, but with this definition majorly centered on the intrinsic(primary) value when value most times also has the secondary value which causes constant price fluctuation.
Now taking price as value, primary value(price) is usually linear (due to constant inflation) and only changes unless more usefulness is added to or subtracted from it, but secondary value on the other hand pegs on different factors majorly centered on sentiment and general human perception which can be due to trend, news, or even charts (technical analysis) which make it pretty hard to measure or make linear. This takes us back to greed and fear, buy and sell, changing demand and supply.
Traders know market is in a constant motion due to changing secondary values, so they either try to take advantage of the situation (greed) by buying when price is low, or take caution/mitigating risk (fear) by selling when price goes south, all adding to the seeming random motion of price. How then do we understand this ever fluctuating market, does it follow a major sequence? Are there trigger points to determine where price will go next?
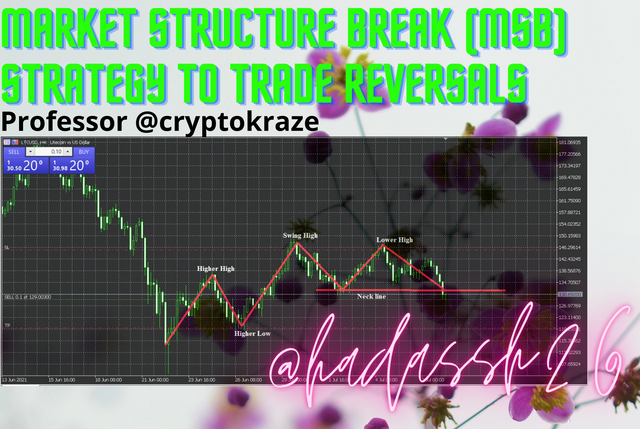
Good day beautiful Steemians, I am @hadassah26, welcome to my SteemitCrypto Academy season 3, week 2 homework for professor @cryptokraze on: Market Structure Break (MSB) Strategy to Trade Reversals. I hope I will be able to treat the questions in detail and make the topic interesting enough to read through.

”1. What do you understand about Market Structure?”
Market structure which is the study to address and be enlightened on how market optimism and risk control reflect on the market trends allowing traders be able to make better trading decisions and eventually profit from the market.
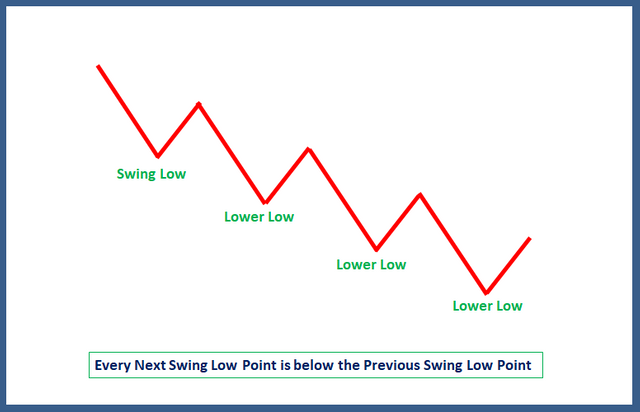
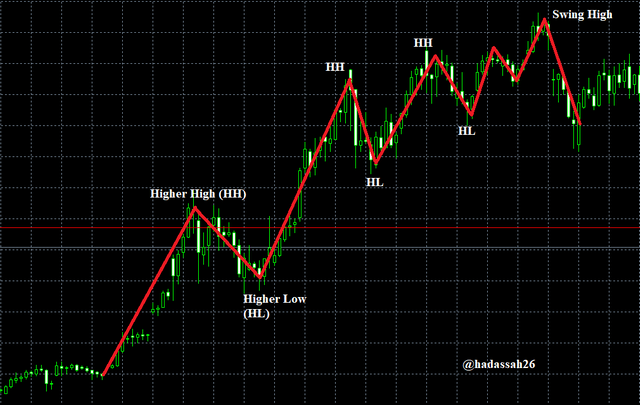
Market structure has shown that the market usually has down trends, uptrends and consolidating periods. Of these periods, we neglect the consolidating period because it usually has no standard form, but the up and down trends have shown to follow a form which we call the Higher Highs and Higher Lows (HH, HL) on the uptrends and Lower Highs and Lower Lows (LH, LL) on the down trends. Pictures below.
”2. What do you understand about Lower High and Higher Low? Give Chart Examples from Crypto Assets.”
Under market structure, price doesn’t continue to trend either ways (bullish or bearish) continuously, the break in either the bullish or bearish trend is called market structure break and it also has some standard form it usually follows. These which are signal and trigger points set by traders such that on price hitting those points traders can most likely tell where next the market will go.
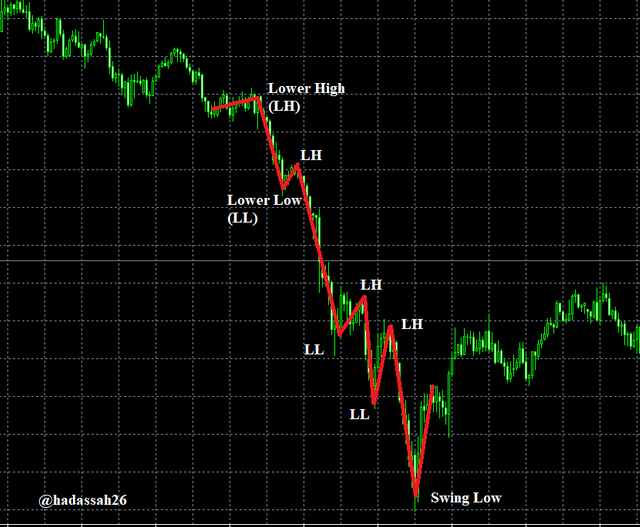
Lower High
Bullish Market Structure Break occurs when price weakens hence reflecting on the chart. This which starts with price not hitting its previous high is a sign of weakness.
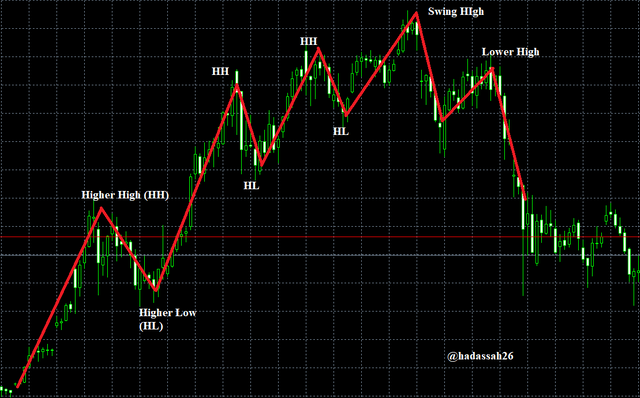
From the chart we see that as price weakens forming a Lower High, not being able to hit its previous high, it soon slumps far down to very low ranges.
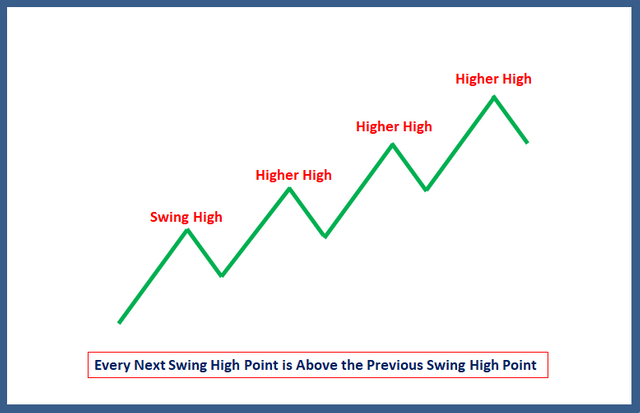
Higher Low
Bearish Market Structure Break occurs when price strengthens hence reflecting on the chart. This which starts with price not hitting its previous lower low is a sign of price strengthening.
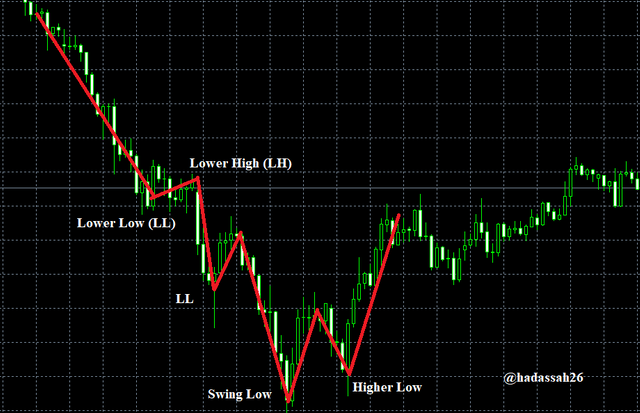
From the chart we see that price gains strength, it picks up from the swing low, forming a Higher Low. This which is a sign of price strengthening and maybe a trend reversal is confirmed as we see price settles at a new resistance point before continuing a new uptrend.
”3. How will you identify Trend Reversal early using Market Structure Break? (Screenshots Needed)”
Lower High / Higher Low and Neck line break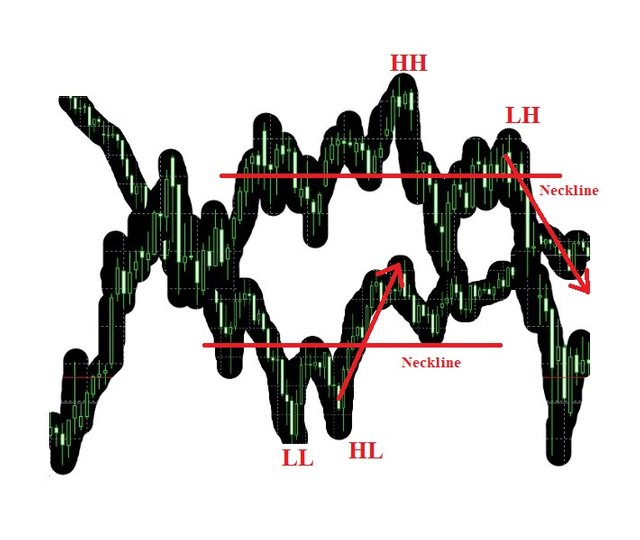
Trend reversal using market structure break is identified by first a change in trend continuation(as explained in Higher Lows and Lower Highs)then when price rather deepens (bearish reversal) or rises(bullish reversal) breaking the immediate support line(Usually the Neck Line), this is a good confirmation of Market Structure break and incumbent trend reversal.
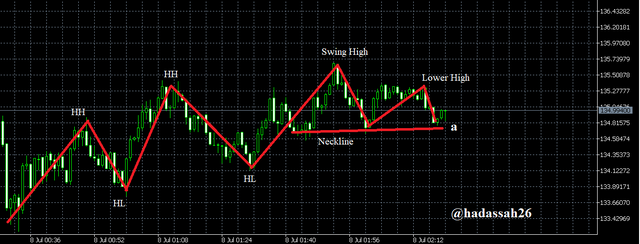
Bullish Trend Reversal Identification
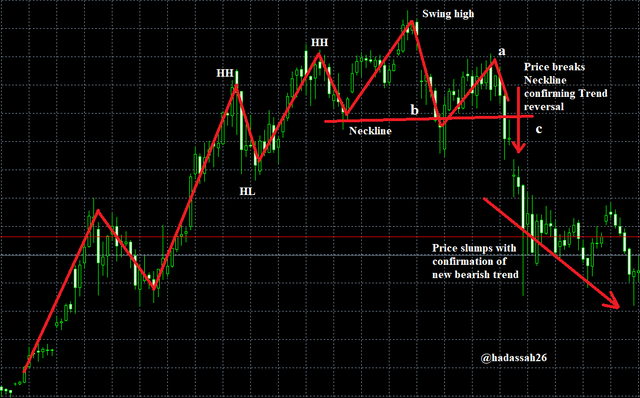
With Price making High lows and High highs on the chart above, we soon see that it makes a new move at "a". This which shows price missing a new Higher High, rather making a Lower High is a first sign of price weakness leading to trend reversal.
We draw our neck line at "b", below the previous Higher low. awaiting price to break through as a confirmation of price weakness and trend reversal.
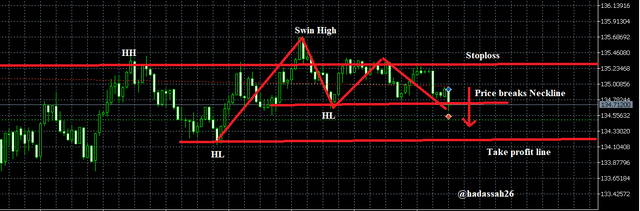
Price breaks through at "c", and on confirmation slumps as a new bearish trend. (Trend reversal Identification Confirmed).
Bearish Trend Reversal Identification
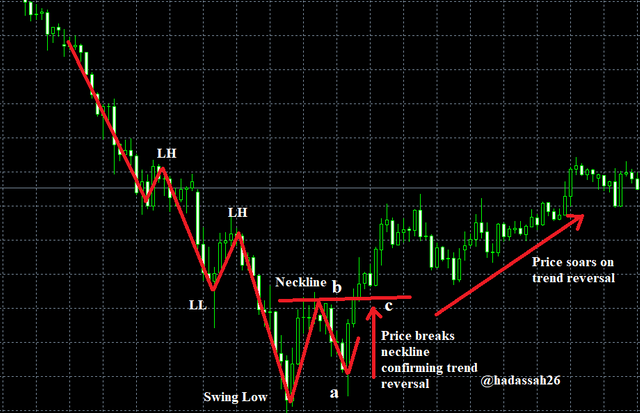
With Price making Lower lows and Lower highs on the chart above, we soon see that it makes a new move at "a". This which shows price missing a new Lower Low, rather making a Higher Low is a first sign of price strengthening leading to trend reversal.
We draw our neck line at "b", below the previous Lower High. awaiting price to break through as a confirmation of price strengthening and trend reversal.
Price breaks through at "c", and on confirmation soars. as a new bullish trend. (Trend reversal Identification Confirmed).
”4. Explain Trade Entry and Exit Criteria on any Crypto Asset using any time frame of your choice”
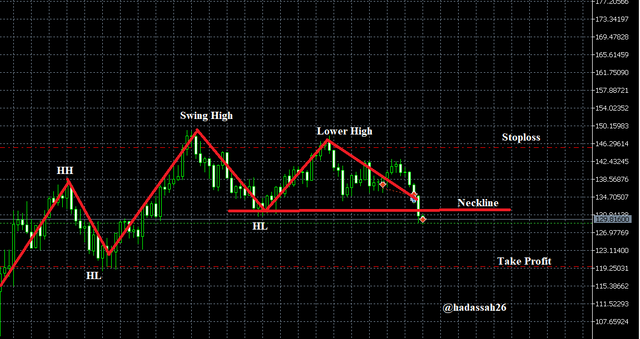
Looking at the chart below from our discussion, we see we should be making a sell entry (since price is reversing from a staggering uptrend).
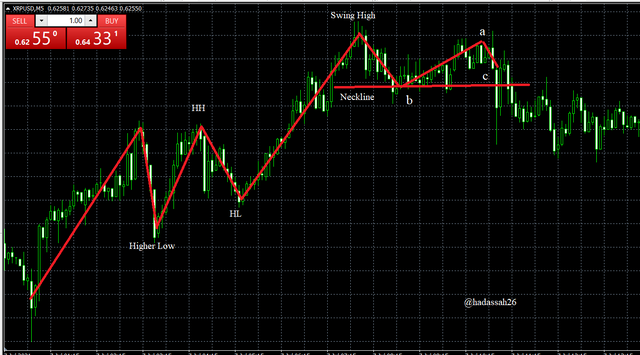
We can see that price has made a Lower High at “a”, Here we begin to suspect for price weakness and draw our neck line at “b”.
Watching price for confirmation and as expected price makes bearish candles breaking the neckline, we can now put our Sell entry a little below “c”. we hope for profits although plan for contingencies as explained in Exit strategies below.
Key Points on Entry Strategy
- Watch for market weakness (Lower Highs)
- Confirm weakness by drawing neckline for market to break through
- Market breaking through neckline with good bearish candles is a good confirmation of sell entry
Market exit can be made when the market goes in our favour and we are trying to count our winnings (avoiding greed) or we are planning against negative price movements mitigating more loss.
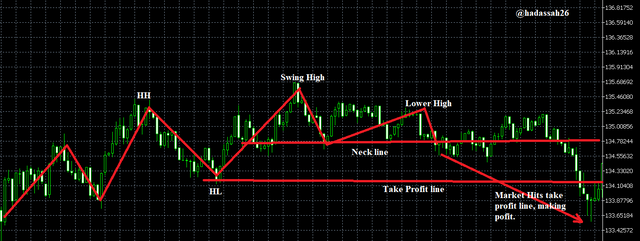
On this trade I see price had been in a previous staggering up trend so I will use the (1:1) (Risk:Reward) ratio.
I place my take profit at “d”. So as soon as market hits there I take my profit.
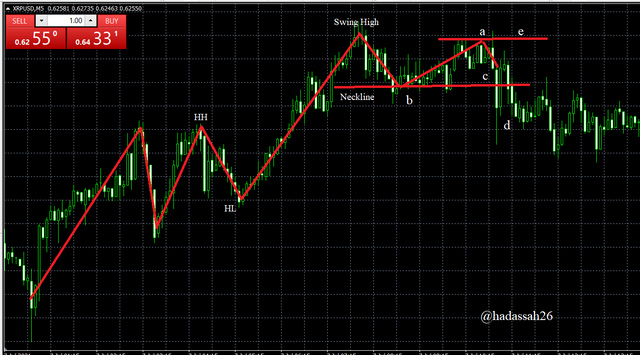
I also put a stop loss at "e" a little above my Lower High, incase market makes a U turn, I can mitigate loss.
The Market goes negative and my stop loss closes although market finally retraces (Not all days are good days I guess.)
Key Points on Exit Strategy
- Give enough allowance for price retracement, say putting stoploss a little above Lower high.
- Do not get too greedy, use a good risk to reward ratio say (1:1) to avoid retracements that eat up profit and incur loss (especially when you are not so professional at trading)
"5. Place 2 demo trades on crypto assets using Market Structure Break Strategy. You can use lower timeframe for these demo trades"
Due to time factor in completing this homework, I have used the One minute time frame and used some shorter trends for this question.
First Trade:
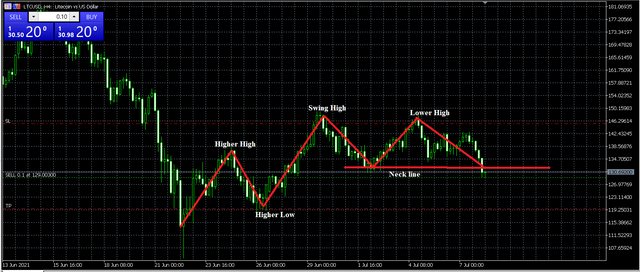
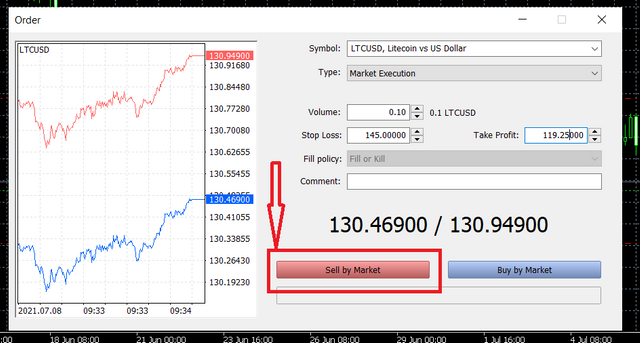
Noticing price pattern in the LTC/USD chart above, we see a lower high after consecutive Higher highs, we then draw our neckline at "a". Awaiting a Neck line Break.
Price breaks the Neckline and we jump on the trade, setting our stop loss above the lower High, and Take profit with a risk reward ratio of 1:1.

Market although staggering finally hits our Take profit after a while, It is a good entry position, Market structure Break has proven to make good trade entries.
Next Trade
We see a pattern forming on the LTC/USD Hour 4 time frame, it is a market break structure pattern. we draw our neckline and on price breaking the neckline we enter a sell position setting our stoploss above our lower high and take profit at a risk reward ratio of (1:1).
For the sake of time we close the trade before hitting Take profit, market still makes some profit. Market structure Break has again proven to show good price weakness points and good trade entry for buyers.

Market Structure Break has given us a better track of price, letting us make good entry points on either price weakness or gain in strength.
Price doesn't necessarily follow its primary value, with always changing sentiments towards price, traders have gotten a more standard technical way to track price, knowing where next it may go and making better trading decisions. This standard way is the Market Structure and Market Structure Break.
Thanks.
CC @cryptokraze
thank you so much for your articles!
Hello @hadassah26
I'm in a bit of disagreement with you here
From this image below,
You said
You can use an OCO order to do the two alright, but your stoploss can't be above your profit point. Stoploss is lower to minimize loss as price dips while profit should be higher incase or should the price move up instead.
Steem on.
Hi @jehoshua-shey, this is a sell trade so it is the inverse of what I think you are thinking.
Steem on.
That's fine but please,
What is a sell trade? And what is stoploss?
@hadassah26
With Contract for Difference Brokers, sell trades can be placed( This involves borrowing a certain amount of currency from the broker and selling at a specific price).
This way, if the trades goes in the bearish direction, you make a profit and pay the broker their "spread".
Regular CFD brokers include FXTM, Hotforex, Deriv etc.
A stop loss on the other hand is a risk mitigation tool used by traders to close trades when price goes against them, this which are either buy or sell trades.
Using a stop loss traders no longer have to be there to close the trades manually, also it helps them set risk to reward ratios and remove emotions when closing trades.
I hope I have been able to answer you correctly sir.
How do you make profit from selling at a lower price?
You borrow BTC @ $34k and sell it @ $32k, where's the profit coming in from?