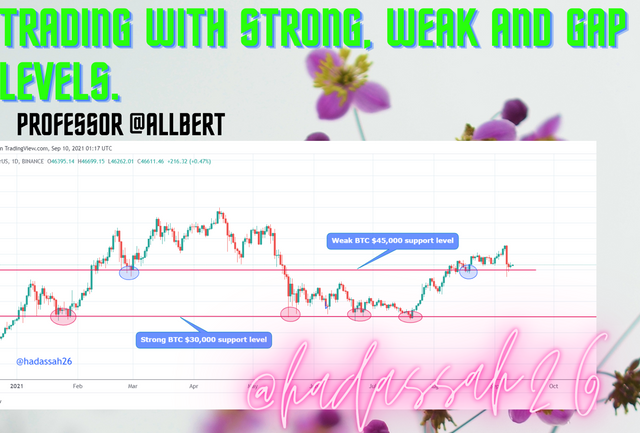
Crypto Academy | Season 4 | Week 1 - Homework Post for @allbert | Trading with Strong, Weak and Gap Levels
Resistance and support levels are not necessarily forceful levels for price to retreat or bounce back from, they are rather empirically suggested levels based on traders' greed and fear that price is most likely going to see some retracement at these points depending on how "major" these levels are. A major example is the bitcoin and the 30,000 USD support level.

Good day, beautiful Steemians, I am @hadassah26, welcome to my Steemit crypto academy season 4 week 1 homework for professor @allbert on Trading with Strong, Weak, and Gap Levels.
"1a. Graphically, explain the difference between Weak and Strong Levels. (Screenshots required)"
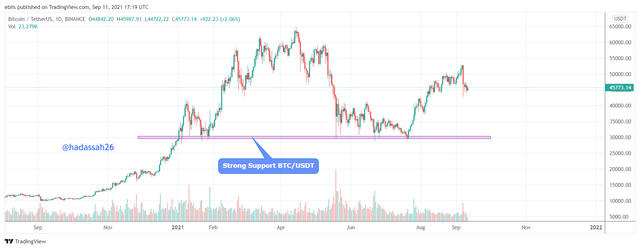
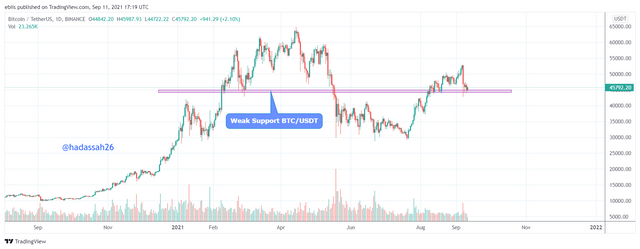
Weak and strong resistance and support levels are differentiated by how much price bounces off on reaching these levels, As I stated earlier, the strength of a resistance or support level is dependent on how much traders either fear price is going to turn back down on reaching these levels (resistance levels) or is going to bounce back upon hitting them (support levels), which are dependent on price's previous reaction on reaching these levels. This not necessarily means that price is going to bounce off on these levels. Let us take an example of the BTC/USDT $30,000 Strong support level and compare it to any other minor support level on the BTC/USDT chart.
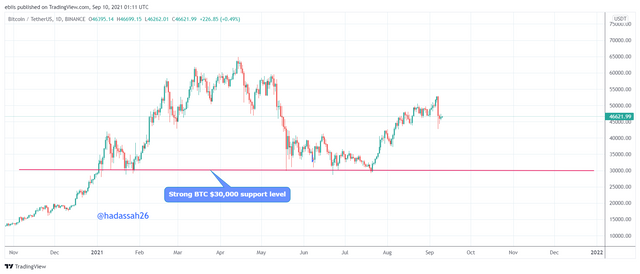
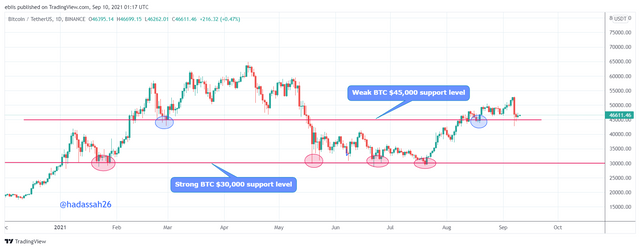
From the charts above we see that the price bounces back up more on the Strong support level, unlike the weak support level where the price only retraces from twice.
"1b. Explain what happens in the market for these differences to occur."
Now going into more technical detail of what goes on in the market during strong support or resistance levels,
Strong Resistance Level
Traders having positions on a trend know it is not going to last forever, they try to speculate where price will see some retracement and even a “U” turn. As is it said, “History is likely to repeat itself”, traders look back to where price had seen some weakness and made “U” turns. At those price levels, traders set their Take profits.
This causes a huge amount of already placed sell positions at these levels causing the price to retrace or even turn back down to a bearish trend, repeating history.
Weak Resistance Level
Here traders get a little skeptical of the trend, maybe due to personal fears, and withdraw some of their holdings. This causes some retracement of the market due to the drop in demand, more traders soon come in to fill those positions, and market bounces back up correcting the initial trend. When this repeats sometimes maybe on coincidence it causes weak resistance levels.
Strong Support Levels
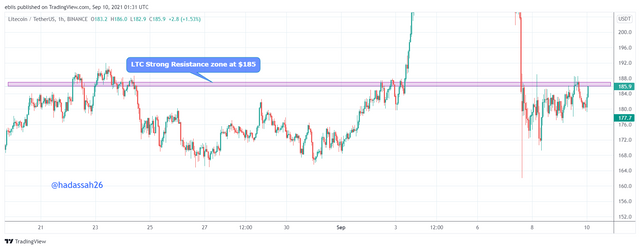
On strong support levels, with the market seeing a decline (bearish trend), traders anticipate when the Market is going to get undervalued and see some new bullish strides. Looking back to history and comparing it with the current market, traders are able to pustulate good repeated points where the market made a bounce back and turned back up. They place limit Buy orders at these price levels.
With an accumulated amount of Buy orders at this level, the market sees a good upturn on reaching the price level. History may have once again repeated itself. Example of a strong support level is shown in the LTC/USDT chart below
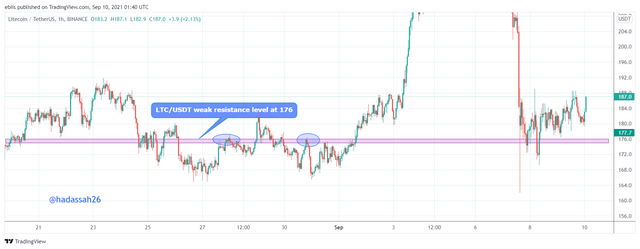
Weak Support Levels
Here traders may impulsively feel the price will make a U-turn from the current downtrend, more may be due to some sentimental news. Traders enter the market during the downtrend and there is some upward retracement, but as the current value of the coin is still not weighted bullish, more traders pull out their holdings and the market corrects to its previous bearish trend.
With these recurring, at some time interval, it causes a weak support point, Example of weak support is in picture below.
"2. Explain what a Gap is. (Required Screenshots) What happens in the market to cause It."
A gap in the crypto market is a slip in the candlestick formation causing space between the close of the previous candle to the start of the current candle.
This which is not a bug, or error in the market is formed due to sudden volume changes in the market causing price to basically jump.
Gaps on busy markets can be hard to find, unless on forex markets during the close of the week and open, are actually a function of market volume.
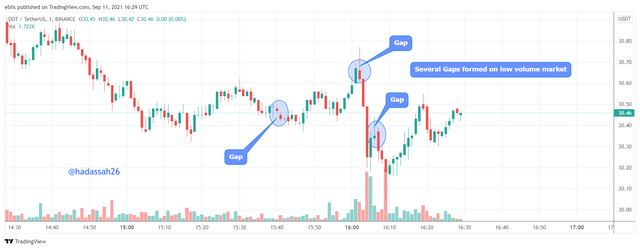
Crypto markets with little market volumes have more gaps because of big differences between one ask price and the subsequent within the space of the selected market's time-frame's open and close period.
In markets with higher volumes, gaps can be detected when there is a volume surge. Causing a slip between a previous close price and the next open price.
Examples of market gaps for high and low volume markets can be shown below:
"3. Explain the types of Gap (Screenshots required, it is not allowed to use the same images of the class)."
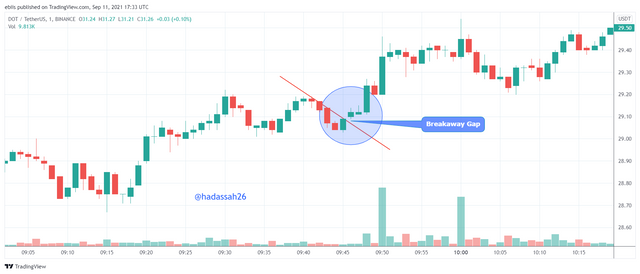
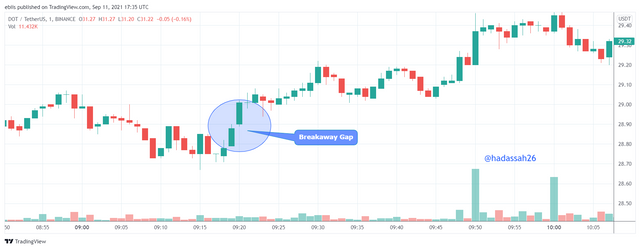
Break Away Gaps:
These gaps as the name sounds happen after market breakouts, usually happening after consolidations. Breakaway gaps are a sign of a new trend and traders can get into the market a candlestick after these gaps to catch the trend.
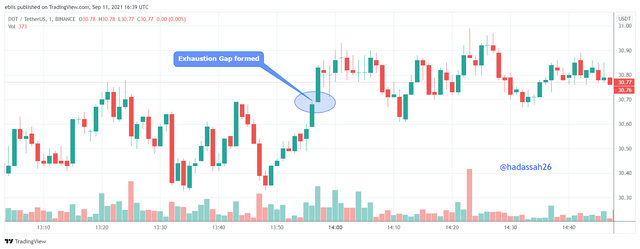
Exhaustion Gaps:
These gaps unlike the breakaway gaps happen at the end of the trends(price pattern), although most newbie traders mistake these gaps as another breakaway gap, these gaps are rather used to determine price last impulse to either hit a higher high or lower low depending on the current trend and then further to a new uncertain pattern.
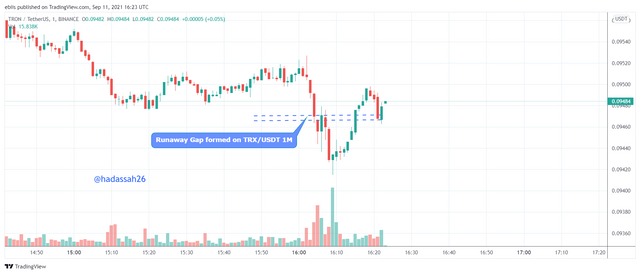
Runaway Gaps:
Runaway gaps occur at the middle/along with trends and can be pretty difficult to identify.
Runaway gaps can be caused by sudden volume increase in the same trend cause price to slip. This can then be used by traders as future support or resistance zones.
"4. Through a Demo account, perform the (buy/sell) through Strong Supports and resistances. Explain the procedure (Required Screenshots)."
.png)
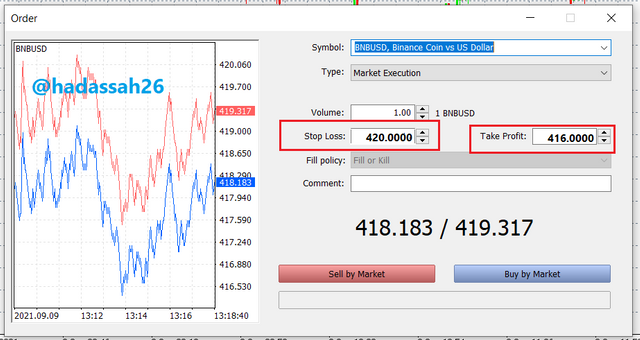
Watching the BNB/USDT chart on the 1-minute time frame, I mark the strong resistance level.
I now await price to reach the level. On price reaching the level, I watch for price action and then make my sell position, placing my Stop Loss and Take Profit. Trade data in the picture below:
.png)
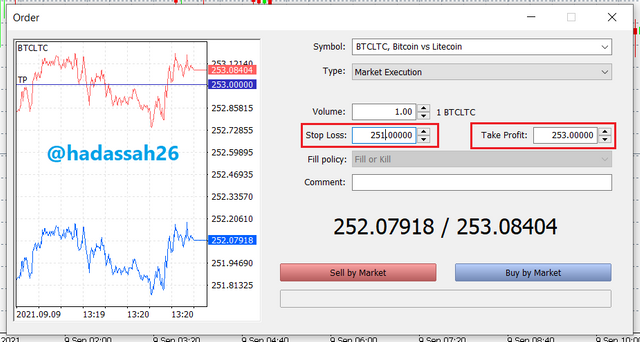
Noticing an Incoming stong support level on the BTC/LTC 1 minute chart, I watch my price action and make my trade, placing my stop loss and take profit appropriately. Trade data in picture below:
"5. Through a Demo account, perform the (buy/sell) through Gaps levels. Explain the procedure (Required Screenshots)."
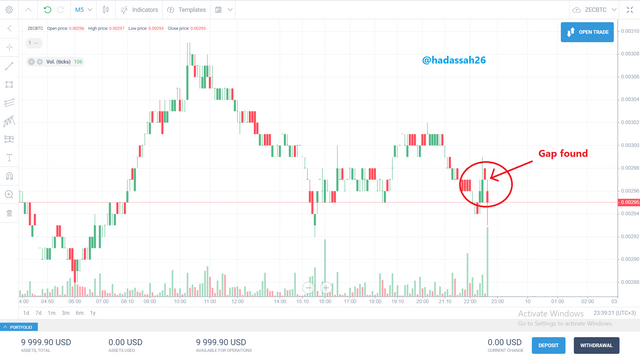
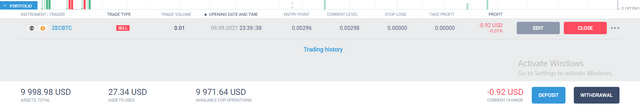
Watching out for gaps can be tedious on high-volume markets, so I choose a low volume market, the ZEC/USDT, and go to a smaller time frame, the 1 minute time frame. I watch for gaps as it is more likely to find them now, I see a breakaway gap formed on the starting downtrend. I place my trade accordingly setting my stop loss and take profit.
In conclusion, Support and resistances are lines to watch out for, but traders should always be aware that price is most likely going to break support and resistance.
Gap areas tell is of where the market has made a slip due to a sudden change of volume. They can now be used as future support and resistance levels,
Gaps include: breakaway gaps, runaway gaps, and exhaustion gaps.
Thanks
cc @allbert.