Steemit Crypto Academy Contest / S4W1 - Crypto Market Technical Analysis by @growwithme
Introduction & Invitation
Hopefully the members of the Crypto Academy and fellow members of the platform will be better. Today's post is about Technical Analysis i.e. TA. Crypto technical analysis makes a lot of sense when you want to trade and learn how to use crypto.
Before proceeding further post I would like to invite @afshaan @steemdoctor1 and @faran-nabeel to participate in this contest too.
What is Technical Analysis
The price study of any stock, crypto asset is called technical analysis. That is, how this currency has given in the past. And under what conditions was it at what price? And now if the same condition is put in front of it, how will it react now?
Based on this we can determine if the price is still at support, and if we should take an entry. Well, when to take the entry is a very later step. Technical analysis helps in taking a good entry and making a good exit.
For example, if I know where support is in Bitcoin or another currency, I will buy it first and sell it at a profit before the support changes. Before the next support is created. Because the next support currency may not be formed by going up, but by going down.
How To Do Technical Analysis
In technical analysis we use chart patterns, indicators, candlestick patterns, drawing tools etc.
First let's talk about candlestick patterns, maybe not all can be discussed because what is important is the same thing.
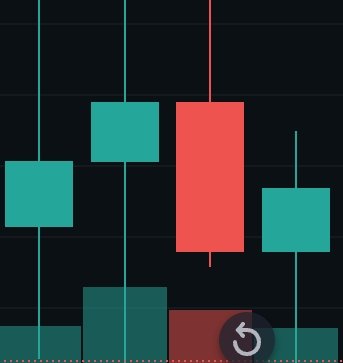
It is very important to understand candles first. The way a green candle is formed is to close above the opening. No matter how low it has been between these open-close times. But if it closes above its opening price, it becomes a green candle. The opposite is true of the red candle.
The time frame is very important in terms of chart viewing.
Some Important Indicators
Now let's talk about the indicators. The one I use the most is the moving average. And I will tell you how to do it. I also use other indicators. And are done. I set the moving average twice, the first at 100 and the second at 50. And I analyze all this on coindcx website.
Difference Between MA & EMA
What is the difference between moving average and moving average exponential? So that's how we can understand the average of all the last candles in the moving average.[MA]
And in the [EMA]exponential moving average the last candle will be the defined higher and the previous one will be lower than that and the previous one will be lower than that and so on for all previous candles.
Works of MA & EMA
Moving Average and Exponential Moving Average tell us where the currency's support is, and what can be done in what timeframe.
This is where RSI comes into play. It is also a very good tool and is quite helpful in technical analysis.
Moving Average and Exponential Moving Average are used three by three and if two of them are converging at least in one place, then it is understood where support is forming for the currency.
Then next comes the time frame, it can be on daily bases, it can be on hourly, or weekly, or fifteen minute bases. And this is the case regardless of currency and in any pair. Binance doesn't offer many tools to do technical analysis but still helps a lot.
How would we do an entry point analysis?
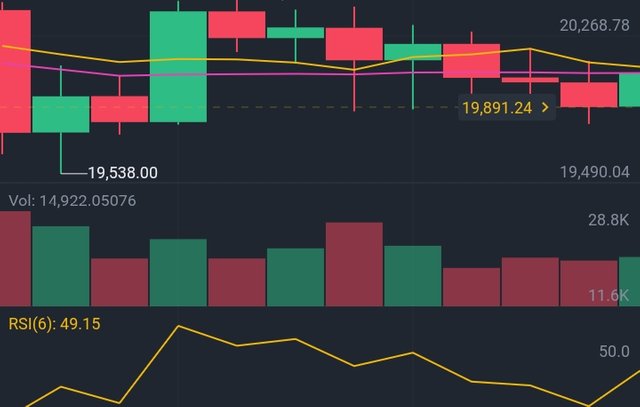
Screenshot From Binance
For this we will use all the tools. If we set the RSI to 50/50 like I do. If it is below 50, it is a seller's market and if it is above, it is a buy market.
And then all the MAs and EMAs come together at a place where the RSI is above 50, so I understand that this is support for this currency for this time frame and this currency can be bought here.
Similarly, if they converge below 50, then support for this currency can be estimated there. And can hold the currency till there is resistance and then sell for a good profit.
Note; Time Frame is very important.
Things to remember:
A trending market requires separate indicators and a sideways market requires separate indicators.
Some popular technical indicators
RSI (relative strength index)
This has already been discussed in the post. In short, this indicator can be harmful in a trending market. It is therefore used in combination with other indicators.
MACD (moving average convergence divergence)
This is the second indicator. It is constructed by combining the Exponential Mong Average. And it proves to be quite beneficial.
Advantages & Disadvantages of Technical Analysis
- The first advantage is that it is easy to learn. And can be easily learned. No company whitelist, or degree required. Limited to your own learning.
- You can use it anywhere ie forex trading, crypto trading and stock trading etc. Its pattern remains almost the same.
- It can be easily learned for little money or even for free. There is a lot of information online that is quite useful in this regard. And then the real thing is experience. The more you experience yourself, the more you will advance. Disadvantages
- Technical analysis has no scientific or academic confirmation.
- It is easy to learn but very difficult to master.
- It has a lot of indicators and methods which can confuse a new user.
My Advices
First of all enter into trading only when you already have a source of income. Regardless of any type of trading.
Take as much time as you need and focus on technical analysis first, learn it and experience it yourself, it can also be experienced without any entry.
This will give you the advantage that when you enter yourself, you will at least have an idea of when to enter and what the chances of profit and loss are. Also, always be careful and if ever your analysis fails, never underestimate the indicator, but focus on your process. It is also true that sometimes the indicator is not accurate as RSI cannot be used alone in a trending market.
Apart from that, take care of the twim frame as well. And try to use the same time frame. Understand sub-indicators and technical analysis well and use them when needed.

Best regards @growwithme
Each indicator has its own function and all of these functions have the same goal, namely to gain profits and minimize losses.
I like to use simple indicators and many people use them like RSI,
You have mentioned some of the popular indicators,
This is good advice, but some people start their business from here and with their perseverance they can earn from trading
Good luck for the contest
👍👍😇
Thank you for engaging with my post. And thank you for dropping am amazing comment.
You are welcome my friend
👍👍👍
The moving average is an indicator that I also use a lot for short entries, and when you are starting out in this world it is very helpful.
Yes, thanks for appreciation.
Honestly, you have written so well about technical analysis and you have also explained in detail about your best technical indicatiors which one of them is my favorite Indicator. Thank you for sharing such and informative post with us. Best of luck to you.
You nicely and intelligenly wrote well, bought you actually didn't answer the question probably because you don't understand or you didn't see them, please try knowing the question to give effective answers.
Thank you very much for attempting
wishing you success.
Thanks for your encouragement. I will try to improve this.
Crypto casino https://similar.casino/review/gunsbet-casino