STEEMIT CRYPTO ACADEMY S5-W5::HOMEWORK POST FOR PROF.@lenonmc21:: ON TRADING STRATEGY WITH VWP INDICATOR::BY @GI-DE-ON::
GREETINGS EVERYONE
I will like to use this medium to say a big thank you to God for the opportunity to be alive and be part of this week's homework post. All thanks to Prof.@lenonmc21 for such a wonderful lecture.
It is in regard I am making my homework post to show I have read and understood the lecture. Thanks to the Entire Crypto Academy board for giving us this opportunity.
INTRODUCTION.png)
[edited in canvas]
You will agree with me that we have been able to get a pre-requisite knowledge of this lecture from the previous weeks. Hence, we have all along been talking about Trading Strategies. Today, therefore, will be no different we have been given the opportunity to learn trading with application with an important indicator which is the VWAP indicator.
We all know the uses and importance of indicators in trading. One of such is the ability to see clearly and give an easy understanding of the various movements that are present in the trading market.
Trading indicators simply make trading more easily done and hence add more beauty to the exercise with more simplicity and coordination in trading.
Therefore, a more standard and detailed explanation will be discussed in the subsequent paragraphs below.

Explain and define in your own words what the “VWAP” indicator is and how it is calculated (Nothing taken from the internet)?
The VWAP indicator is an abbreviation that stands for VOLUME WEIGHTED AVERAGE PRICE. The VWAP indicator is simply considered one of the best indicators present in the world. This is hence one very big qualification to attribute to an indicator. The reason for this unique attribute is the fact that the indicator can simply perform a task most indicators are not able to do which is the ability of this indicator to take cognizance of the total amount of money that is been traded over a certain period.
The ability of this indicator to calculate the total amount of money that is been traded is one added advantage to the side of the trader trading using this indicator. Hence, this indicator is similar to the moving average indicator in structure which simply appears in a single line.
From the above, I will conclude by saying the Volume-Weighted Average Price (VWAP) is simply one of the best trading strategies that are been applied by traders in their various trading which gives the average price of the traded asset over a period of time-based on the volume processed and the price it was transacted.
One most important features of the VWAP indicator is the leverage it gives to trades who utilize it to carry out transactions at diverse time frames with the same criteria.
HOW TO CALCULATE THE VWAP INDICATOR
Since this indicator takes the trader amount of capital various investors use along the volume, it, therefore, has ways in which all this can be calculated to give effective results. This is shown below.
Given:
- The price,
- The volume of money traded
- Number of daily candles
This is therefore put into a formula for easy calculation as displayed below.
Mathematically,
The price+ Volume of money traded/Number of Daily candles.
In a statement form: It is the price added by the Volume traded divided by the daily candles.

Explain in your own words how the “Strategy with the VWAP indicator should be applied correctly (Show at least 2 examples of possible inputs with the indicator, only own charts)?
In successfully applying the VWAP indicator, one must, first of all, know how to properly apply this indicator before anything else can be done for this virtually the first port of call. Hence, in applying this indicator there are a few steps to take which are noted down below.
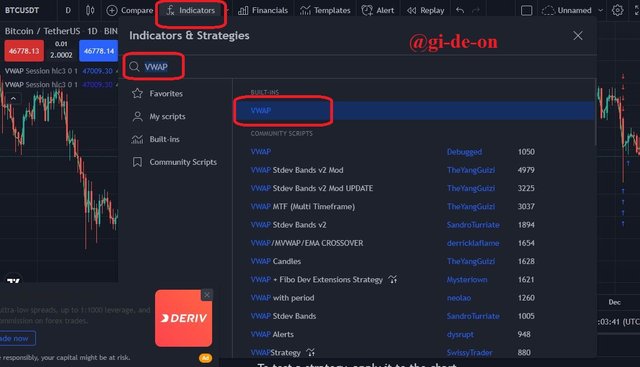
- The very first step to take, is by looking at the top screen of your desktop/device, there you will say many options all you have to do is click on
indicatorand then type in the name of the indicator you wish to use. (For example type in the VWAP list of options will come up having what you searched for inclusive all you have to do is click on it.)
[screenshot taken from tradingiview]
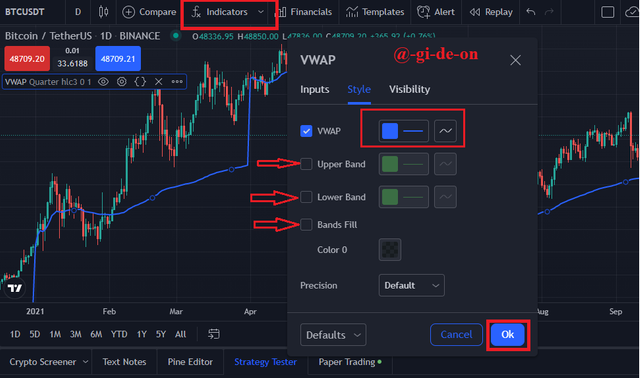
- Following the above-listed step, you will have to look at your charts once you notice that this indicator had been successfully added, you will therefore look at the top left of your chart under the buy and sell an option (usually displayed with Red and Blue) and click on the indicator nut which is below the buy and sell position. This is to check for details like Upper Band, Lower Band, etc.
[screenshot taken tradingview]
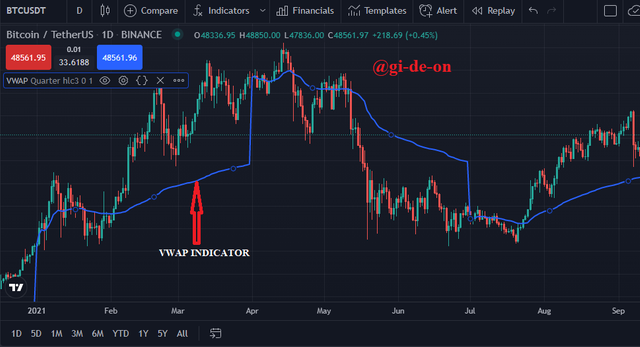
- On a concluding note all you have to do once the above two steps are followed and the indicator is properly displayed on the chart, you will have to click on the line/structure of the indicator then a sub-menu will come up with a list of items for color fill and line thickness all you have to do is make the indicator line to be a little thicker that is all.
[screenshot from tradinview]
HOW THE STRATEGY WITH THE VWAP INDICATOR SHOULD BE APPLIEDOnce the indicator has been added to the chart successfully, as explained and shown above then, it would be important for the trader to know how this indicator is been applied or utilized to carry our successful trading. This is therefore explained below with examples to explain more.
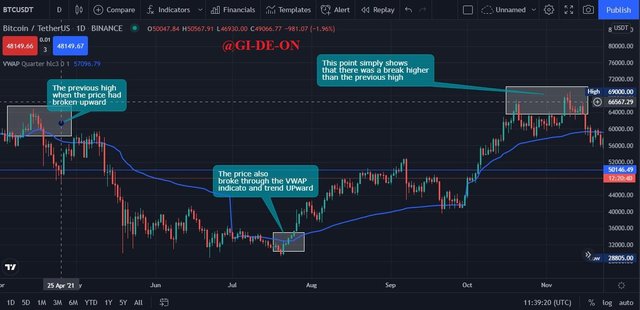
BREAKING OF THE STRUCTURE FROM BEARISH TO BULLISH AND VICE VERSA:First and foremost, it is advisable/vise for a trader to, first of all, observe the price chart of the market, then the trader has to wait for the already formed maximum or minimum price formed in the chart to be broken in either case either bullish or bearish. This is similar to when the already forming trend isn't complete yet, the trader has to wait either for days or over a period of time for this already forming trend to be completed.
[screesnhot from tradingview]
Hence, this will make it possible for the indicator VWAP to affect the break to affect the validity of it and this is therefore applicable for other criteria like the volume of the money traded and others.
RETRACEMENT TO THE VWAP (USING FIBONACCI):This is also an important feature to look at. When the traded assets price starts moving in a backward direction from the previously formed trend either bullish or bearish. Once this is noticed the solution out of it is simply to make use of the Fibonacci Retracement tool in measuring the previous/last momentum of the trend from the bottom (support line) to the top ( resistance level).
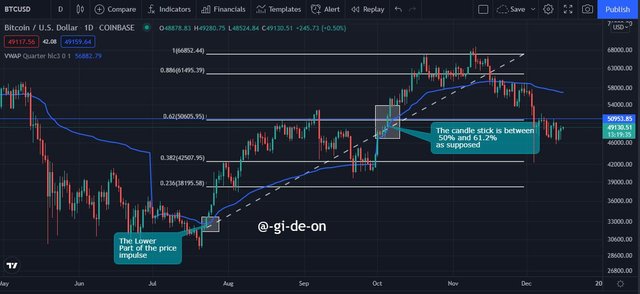
[screenshot taken from tradingview]

Explain in detail the trade entry and exit criteria to take into account to correctly apply the strategy with the VWAP indicator?
For trading with the VWAP indicator it is quite less tedious or will I say an easy process to go with provided all rules are being met and conditions kept. Hence, in setting the entry and exit criteria for the strategy using the VWAP indicator considering both the bullish and bearish trend, below is a guideline to follow for successful trading.
As earlier said, when the price chart of the traded asset starts to form structures similar to the previously formed structures (having the same maximum and minimum levels) it would be very wise for the trade to exercise patience here and wait for these formations to be fully completed. This will in turn result in effective utilization of the applied strategy and makes it function and work effectively.
Also, as explained above, for effective workings of the indicator in use (VWAP), it would be of help for the trader to, first of all, know the trend of the market before performing a trade. By knowing the current direction of the market, whether bullish or bearish it would therefore help the trader know how to perform the setup.
Once the observation is done, and the break has been validated, it is important to also wait for the price to begin to retreat not minding the direction of the trend either Bullish or Bearish, therefore once this is done it is therefore important to trace the "Fibonacci Retracement" at the impulse waiting patiently for the price to meet with the VWAP. It is important to make entry at the zone of 50% and 61.8%.
Among other things, it is also important to take risk management into consideration. This implies that setting the "stop-loss" must be below 50% and 61.8% zone. Furthermore, the Take Profit will be set at 1.5 times a little above the Stop Loss, which simply means that the risk and benefit ratio be set at 1-1.5. Hence, a good trader must have risk management, not above 2.

Make 2 entries (One bullish and one bearish), using the strategy with the “VWAP” indicator. These entries must be made in a demo account, keep in mind that it is not enough just to place the images of the entry, you must place additional images to observe their development in order to be correctly evaluated.
For the purpose of this lesson, I have been able to set up a trade for both bullish and bearish trends of the BTC/USD token as shown in the screenshot below.
BULLISH TREND:
After reading and going through the lesson and having gone through the trade setup done by prof.@lenonmc21. With the keen observation of my chart, I had the opportunity which satisfies all the necessary guidelines and conditions also using the VWAP indicator and also setting the Fibonacci Retracement which specifically gave the determined price for entry.
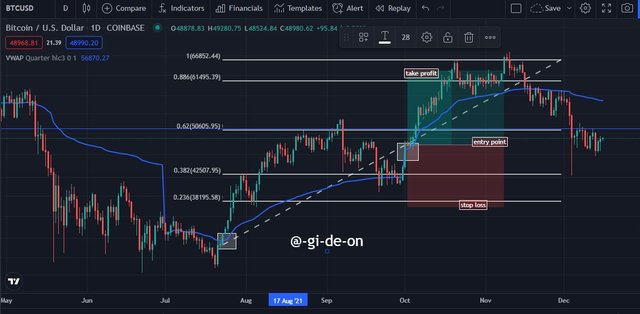
[screesot taken from tradingview]
At the point where the VWAP indicator confluence through the price of the traded asset which is simply between 50% and 61.1% which shows a perfect entry point. It is also important to know that bullish simply indicates that the traded asset is simply having an uptrend.
BEARISH TREND:
This simply indicates that the price of the traded asset is simply having a downtrend. As explained for the bullish trend.
The trade setup was simply done with all conditions and requirements met. This is therefore shown below in the screenshots.
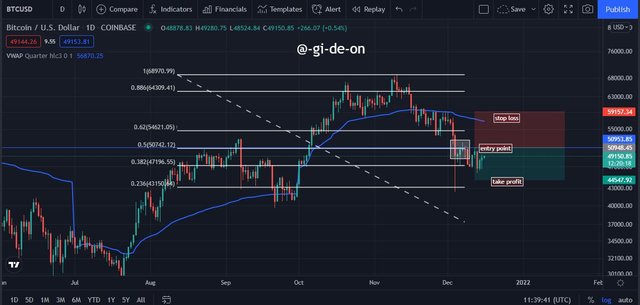
[scrrenshot from tradingview]

CONCLUSION
All thanks to God for giving us the strength to have come this far. Maximum regards to Prof. @lenonmc21 for this very interesting lecture.
Through this wonderful lecture, we have been able to know the meaning of the VWAP indicator and various conditions in which this indicator can simply be used for effective results.
I will conclude by saying knowing the various ways a market trend is an important factor to trading hence, understanding the bullish and bearish trend gives a trader an edge for achieving success and the best utilization of the VWAP indicator works better if a trader understands the basics and conditions necessary for the utilization of this indicator.
Thanks for reading.
Best regard everyone
CC:@lenonmc21


@gi-de-on check your image cover again and make necessary correction before professor grades your work (just an observation)
Thanks a lot for your observation, I really appreciate it.
I have effected the correction.