||STEEMIT CRYPTO ACCADEMY||S5-WEEK2|| HOME WORK POST ON || BY @GI-DE-ON
GREETINGS EVERYONEI will like to use this medium to say a big thank you to God almighty for allowing us to be among the living not just us but our entire family. This is indeed going to be a wonderful week a big thank you to the entire Academy for giving us the privilege to be a participant in this week's homework post.
.png)
[image edited in @canva.com]

INTRODUCTION
Before successful trading can be carried out, a trader/investor has to simply understand all these very important concepts about crypto trading. The understanding of how the crypto asset prices move and the various terminologies applied will help boost the success rate of any trading. Among other analytic knowledge on trading, one very important aspect to understand is the use and applications of trends and also how to read them will therefore give the trader an edge to successful trading.
This simply helps give the directional price movement of an asset, inclusively having in mind that there is the presence of what is known as the *Bullish and Bearish trends/seasons in the market, so, therefore, understanding how all these things works is quite advantageous.
a) Explain your Understanding of Trend Reversal. What is the benefit of identifying reversal patterns in the Market? b) How can a fake reversal signal be avoided in the market? (Screenshot needed).
TREND REVERSAL:
Saying that the market price of an asset is undergoing trend reversal is simply said to mean either the decline in the price of the asset from an up-trend to a downtrend. it is important to know that this can occur the other way round where the price of an asset changes in direction from a downtrend to an upper trend.
When talking about Trend reversal it would be important to discuss these alongside the Bullish and Bearish trends.
Trend reversal can simply be explained in a more simplified term by example them in terms of the bullish and bearish trend.
Bullish Trend Reversal:
This occurs when the price of an asset simply pumps upward from a downtrend

[image from tradingview]
This is simply the reversal of a market price from a bearish state to an uptrend. Or When a bearish market with a down tends to begin to move in the opposite direction (I.e Uptrend).
Bearish Trend Reversal:
On the other hand, this is simply the direct opposite of the Bullish Trend Reversal. This seems to occur when the bullish market of an asset begins to change and move in the opposite direction. Or when the market price of an asset decline from the state of an uptrend to a downtrend.
[screenshot taken from tradingview site]
b) How can a fake reversal signal be avoided in the market:
The best ways to avoid the fake reversal signal can simply be illustrated in the chart/screenshot below.

[screenshot taken from trading view]
From the chart, you will observe that there are multiples false breaks and also an uptrend alongside a downtrend on the Right-hand side of the chart. From mere observations, newbies in crypto trading will rush in and enter the market hence, the professionals simply come in and take advantage of the market entering the short form value after then comes the downtrend to dismiss another newbie in the market.
The best way to avoid being caught up/being a victim of a false reversal trend is for the trader/investor to simply take his time to wait for the already forming range of the market to die down by either giving the market a day or two before returning to it by then, the forming range might have completed.
From the chart above, it can be seen that resistance levels had keyed into holding the market static, and several fake reversal trends were present in the market which later could not hold and then led to a bearish trend. As applied to the Left-Hand Side of the chart which later led to a bullish trend.
Also, there are other ways to avoid being cut up in a fake trend reversal these include:
Avoid following parabolic moves: This can simply be said to mean moves that tend to trend in one direction which lacks the support lines to follow higher prices.
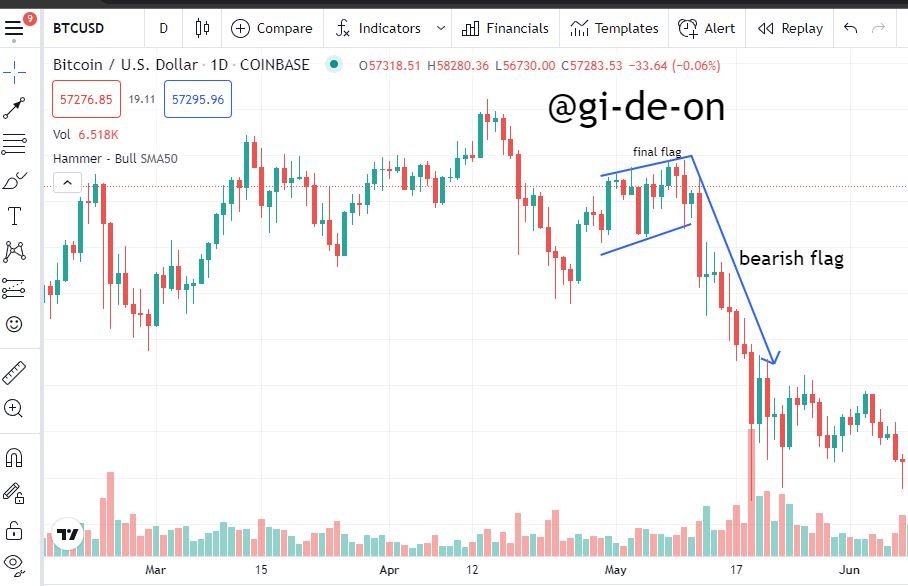
Furthermore, it would be wise to trade all sorts of breakouts with buildup. This can be said to mean the market price of an asset reoccurring in a zig-zag motion until the price either become a downtrend or an uptrend. These buildups can simply come in a form of a flag or zig-zag motion.
Give a detailed explanation on the following Trend reversal identification and back up your explanation using the original chart. Do this for both bullish and bearish trends (Screenshots required). a) Break of market structure. b) Break of Trendline. c) Divergence d) Double top and Double bottom.
MARKET STRUCTURE:
The market structure for me can be said to mean the structure of the price system of an asset that simply appears over some time. The market structure is simply one important technical analyst which shows the past market movement of an asset and hence can help the trader predict the future price movement of an asset price.
A more descriptive form of market structure can simply be said to be a combination of higher lows and also higher highs which have to do with the bullish and bearish nature of the price movement of an asset involving the continuous structure of the lower lows and the lower highs.
There are mainly two (2) types of Market Structure this can be said to be:
- The Bullish Market structure
- The Bearish Market Structure.
BULLISH MARKET STRUCTURE:
Normally, bullish in trading is simply said to mean that the prices movement of a crypto asset is simply going to rise or is on a higher side already. This can be said to mean that there is an uptrend in the market. hence another name for bullish is simply UPTREND.

[screenshot from tradingveiw]
Hence, in market structure, Bullish simply has to do with the successful formation/structures of the higher highs and the higher lows present in a market price/chart movement of a cryptocurrency.
BEARISH MARKET STRUCTURE:
The bearish is in crypto trading is said to mean a downtrend. This is when the price movement of a crypto asset is experiencing is fall in price. Hence when the price of any crypto asset has fallen, it is said to be a DOWNTREND or BEARISH.

[screenshot from tradingview]
Hence, in a market structure, the Bearish structure is simply the successive formation of the Lower lows and the Lower Highs that are present in the price movement of any crypto asset. This is best explained in the screenshot above.
BREAK TREND LINE:
The trend line in crypto trading is a very important technical analysis tool that helps show the trader/investor the direction price movement/direction of crypto-asset price in trading.
Trend break is simply a reversal signal that simply implies that there is going to be a change in the direction of a crypto asset price in the stock market over some time. Once a trend break is initiated into the market, there are likely to be two things to be formed which are, the assets price either goes upward (Bullish Trend/Uptrend) or goes Downward (Bearish Trend/Downtrend).
BULLISH TREND BREAK:
From the chart below, you will notice that after several attempts and strongholds (consolidation) present in the chart price of the BTCUSD asset, the break, therefore, gave way for the bullish trend to happen. This, therefore, implies that a Bullish trend break is simply a break that occurs after there has resistance or consolidation in the market price of an asset that is to say that after the consolidation the price of the asset simply had an uptrend as shown above.

[screenshot from tradingview]
BEARISH TREND BREAK:
You can see that from the chart above, after various consolidation levels present in the market on the BTCUSD asset, the price of the market letter had a downtrend which simply signifies that there has been a fall in price in the price of the asset.

[screenshot from tradingview]
In a nutshell, you will notice that there has been a constant rejection of the trend line in the price of the chart of the asset. This simply signifies that the crypto asset has very strong pricing. It would interest you to know that Trend break simply has to do with a trend reversal. That is to say, since the price movement of the asset keeps rejecting the trend lines, it there allows for trend break to come in, and then the crypto asset price might either undergo a trend reversal in the bullish/uptrend direction or the bearish/downtrend direction.
DIVERGENCE:
Divergence simply has to do with the contradictions that occur with the price of an asset and the technical indicator in use. More simply, I will say divergence is the movement of the price of a crypto asset in the opposite direction of the technical indicator that is been used/been applied.
The contradiction of these two key concepts (Technical indicator and the price movement of an asset) simply leads to what is called the Positive Divergence and the Negative Divergence.

BULLISH DIVERGENCE
[screesnhot gotten from tradingview]
The positive divergence has to do with the movement of an asset price in the high direction this has to do with the bullish trend. Where the price of any crypto asset tends to go in the higher direction and the technical indicator in use goes the lower. Or the uptrend of the price system of any crypto asset and a lower technical indicator.
While the Negative Divergence has to do with the fall in the price of any crypto asset while the technical indicator moves in the opposite direction. This is the direct equivalent of the Bearish trend which has to do with the falling of a crypto asset price system. This tends to happen when the price of any crypto asset had a dip or a downtrend.

BEARISH DIVERGENCE
[screenshto gotten from tradinview]
DOUBLE TOP AND DOUBLE BOTTOM:
The double top and double bottom structure occurs/is formed when the price movement of any crypto asset is in a reversal pattern. Hence, when the chart pattern is in the form of M it is referred to Double top. Similarly for the Double bottom when the chart pattern is in the form W then we say the double bottom is formed.

DOUBLE TOP
[screenshot from tradinview]
The double top is formed during a bullish trend. Hence after the consolidation hold has been observed over some time. Hence we tend to see the price retesting the previously attained high and then a downtrend is formed with already formed double tops. This is illustrated above using the BTC/USD chart.

SOUBEL BOTTOM
[screenshot from tradinview]
Double bottom is formed in a downtrend. This happens when the price of an asset refuses to form a new low lower. Hence the price of the asset, therefore, retests the previously attained low. This is best illustrated in the chart above on the asset of Gold/U.S. Dollar.
Place a demo trade using any crypto trading platform and enter a buy or sell position using any of the above mentioned trend reversal/continuation pattern.

[screenshot from tradngview]
DOUBLE TOP CHART FROM BTC/USD
From the above screenshot which displays a price chart for BTC/USD. Having a close look at the chart you will see that a second top was therefore created when the price of the asset in attempt to change in price to differ from the previous Higher High failed. This was because there was a reduce in buying pressure of the asset.
At the time the trade was placed, it shows that the Bear/Bearish are simply taking over the market. Hence the reason why my trade is been place in the direction it is.
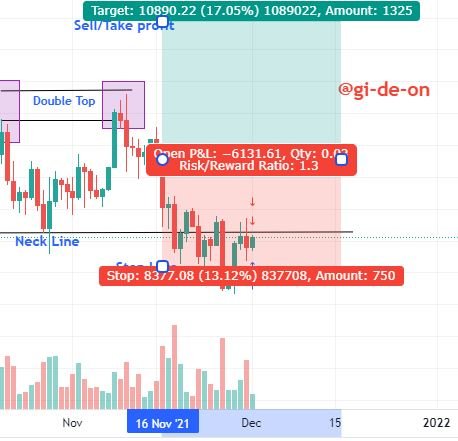
[screenshot from tradingview]
This is a more visible chart for this trade. Hence, the chart have a detail of what the market/price target is, the Risk Level of the market and lastly the Stop Loss.
CONCLUSION
I must say that this lesson was indeed a very productive one. Hence, it is important to know and understand how this reversal pattern works for successful trading. The understanding of the trend lines, trend breaks, market structures, double top, and double bottom. All these put together with a good understanding of them will lead to successful trading.
The lecture was very wonderful, all thanks to @reminiscence01 for this very wonderful lecture. It was indeed a blast.