Steemit Crypto Academy | Season 3: Week 7 || How to create an account on TradingView, how to use indicators,tools, features of tradingview || By @ghiasahmad ||
Assalam-o-Alaikum!
I hope that you will be well with the blessings of Allah Almighty. How was your day? First of all, I'm very thankful to the steemit team that they created this platform for learning and this is also a good way of earning. Steemit.com introduced this community that is very useful for users who don't know about cryptocurrencies. I am very thankful to Prof. @yousafharoonkhan for giving us a chance to learn about the trading views.

.png)
Question no 1:
Defining the TradingView site and how to register an account in trading view? what are the different registration plans? (screenshot necessary)
.png)
Answer Question 1.
Defining the TradingView site
First of all, I wanna tell you what is the function of tradingview.com. This is a website to analyze different currencies such as crypto trading, forex trading, and currencies of other countries. This is also used to watch the stock market of gold, oil, silver, and many more. This is such a useful website for traders and inverters.
- Its main purpose is to help traders in trading to display the up and down stock ratio of their related currencies or others. Shortly, this site is used to display values of currencies and stock of gold, silver, and oil, etc.
- It displays all stocks in the form of candles, lines, and other bars. It provides many features to its users. I will talk about its features but first of all, I'm going to see how we can enter this site to use it and how we can get all its facilities. But, first of all, I will create an account for myself on this site.
Create Account
Now I will show you how to create an account on tradingview.com. I will show you in different steps that will explain it correctly. First of all search treadingview.com on your search engine like Google, Firefox or Explorer, etc. As I searched on Google. Then some results will be displayed on your screen in some seconds.
I directly searched tradingview.com but if we will search trading view then we will get results on our browser page. So, I get results in the search trading view on my browser page. I will click on the first link that will access me to the site.
After clicking on the link, the website will be open in your tab. Now, here is the first step to creating an account and I will start steps from this page for better understanding.
Step 1.
Click on start free trial. This button will access you to create your own personal account on the trading view site. This is almost the first step to create an account n this site.
After clicking on the button of Start Free Trial you will see three charts about the prices of the account. Obviously, high price account will give more benefits but according to the lecture, I will create a free account that is totally free of cost. I scroll down and saw Try Free Basic plan. This plan is fully free of cost for users.
Step 2.
I clicked on the Try Free Basic plan and a new page opened.
After clicking on Try For Free a new tab will be open and a new page will appear with Google, Facebook, Yahoo, Twitter, and Email. For registration with email click on the email option and this page will shift you to a new page.
Step 3.
You will give your name, your email address, and password, and then check both boxes and fill your reCAPTCHA.
Step 4.
Step 5.
Step 6.
This password has two types. One who will be suggested by site and second who will be suggested by you. The password which the site will suggest will be most secure but it is not easy to learn this password. So, it depends on us which way to add a password.
After giving password check to these two boxes. One box will sure that you are agreeing with the privacy policy and terms and conditions of this site.
After filling reCAPTCHA you will see a new page with the message "not active account yet". It will be active by verifying the message from your Gmail sent by this site.
So, open your Gmail to verify your account. For this open your mail and click on Trading View inbox mail. When you will click on the trading view message then you will see a page.
Step 9.
A blue button will be found on the page and "Active Account" will look in the button. So, click on the button to verify your account and a new tab will be open.
Now you will see some requirements. I explain them in steps.
Step 10.
Enter your profile picture maximum of 700 kilobyte(kb).
Step 11.
Step 12.
Step 13.
After clicking on continue, a new tab will be open and now the account is totally ready.
.png)
Second Part of Question
.png)
Registration Plan
There are four registration plans in it and all plans are beneficial.
- Pro Registration Plan
- Pro+ Registration Plan
- Premium Registration plan
- Try For Free Registry
| Pro | Pro+ | Premium |
|---|---|---|
| Pro version of this site is so beneficial | Pro+ version is the better than pro version and this version charge 29.95$ per | Premium version has many benefits and this is one of the perfect version. This version charge 59.95$ per month |
| It Provides: | It Provides: | It provides |
| Pro version charge 14.95$ per month | All the benefits of Pro, plus: | |
| 5 indicators per chart | 10 indicators per chart | 25 indicators per chart |
| 2 charts in one window | 4 charts in one layout | 8 charts in one layout |
| 20 server-side alerts | 100 server-side alerts | 400 server-side alerts |
| Ad-free | 2 devices at the same time | 5 devices at the same time |
| Volume profile indicators | Intraday exotic charts | Second-based intervals |
| Custom time intervals | Charts based on custom formulas | Alerts that don't expire |
| Multiple enhanced watchlists | Chart data export | 4x more data on charts (20K bars) |
| Bar replay on intraday bars | Indicators on indicators | Publishing invite-only indicators |
**Fourth registry plant is "Try For Free". This plan is free of cost.
These are four registry plans of the tradingview.com site.
.png)
Question No. 2
Explain the different features of tradingView and what is your favorite feature and why?(screenshot necessary)
.png)
Explain the different features
Now, I will talk about its features. It has many features that make it easiest and fast for a trader to work on it. I will talk about its common features.
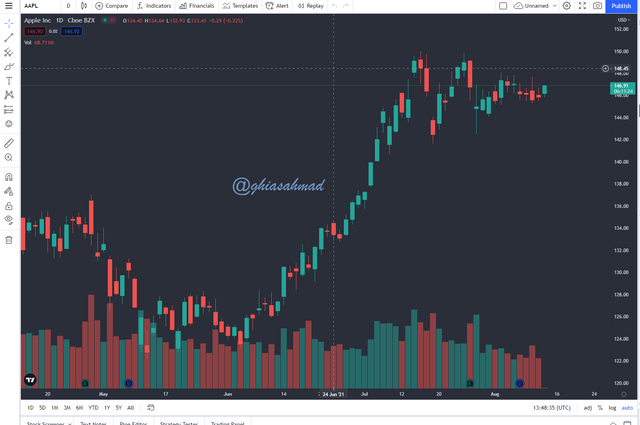
Chart
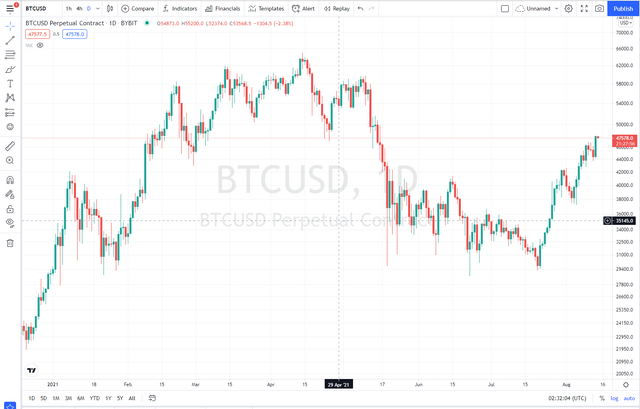
Its most used and most important feature is its chart which makes it most popular and trustable for traders. A chart shows live updates of the stock market of various types. The chart has also many features that make it most interesting and they increase the analysis of traders. This is the most liked feature on this site and this is also so useful for trading and traders. e can analyze livestock market of currencies by this chart.
Its most amazing feature is its appearance and indicator tools. We can change its background color. We can change it by outside light and its appearance look good and make it interesting.
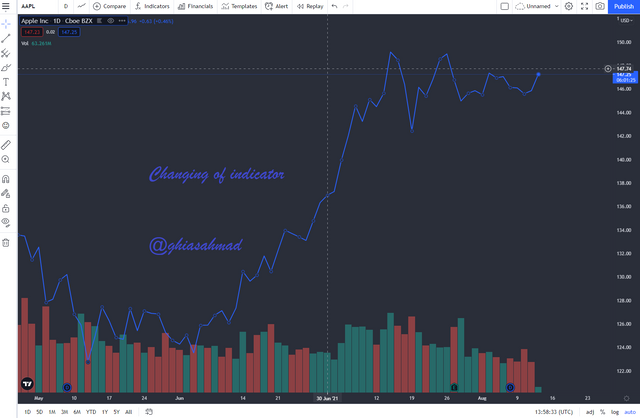
We can change the indicator's type and shape. This feature of this site is the most popular and most used.
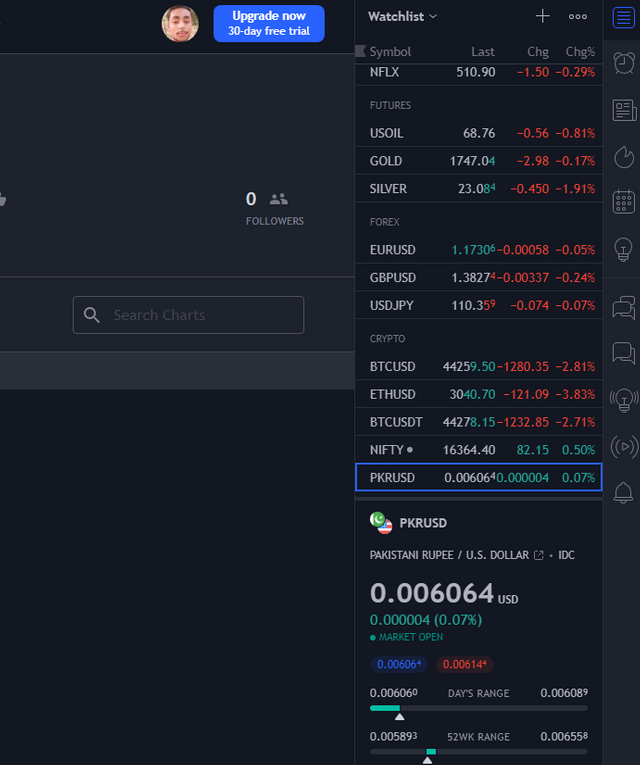
Watch List
Its second most important function is its watch list. watch list is one of the most amazing functions on this site and this is also very important for traders and its users.
A watch list is the shortest way to find any such currency. we can add or remove currencies in our watch list and this feature of the site make it most papular. If you are looking chart of BTC stock then suddenly you want to check the stock of forex then the watch list is the shortest way to see the stock of any currency because it is found on the right side of your device and you can check the stock of currencies with one click. This feature is most papular which makes this site to favorite for traders.
We can create our own watchlist if we are using pro or premium versions but, we can add more stocks to our watch list free of cost.
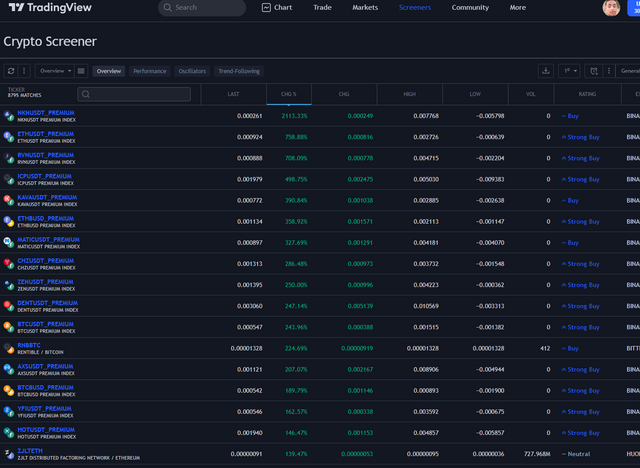
Screener
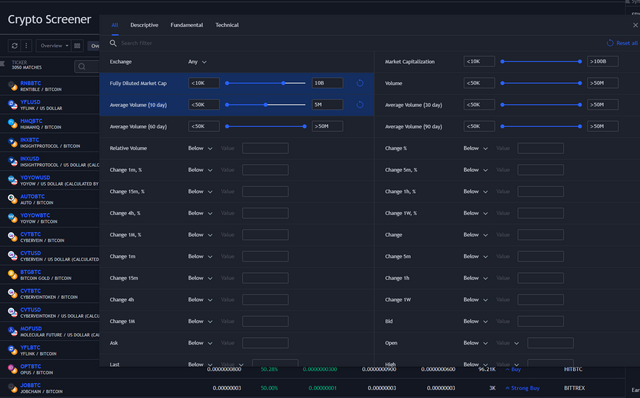
This is one of the unique features of this site. with the help of a screener, you can analyze the ratio of currencies high to low or low to high. You can do this by changing the direction of change%. This is a unique tool and feature on this site and this also has a lot of use.
By clicking on the filters you can analyze currencies ratio by time and results will be shown on the chart of the screener. This feature makes it easy to use and this is also so interesting and so cool tool of this site.
.png)
The second part of the question
What is your favorite feature and why?(screenshot necessary)
.png)
.png)
Question No. 3.
How to set up a chart in TradingView and use two tools to edit it.(screenshot necessary)
.png)
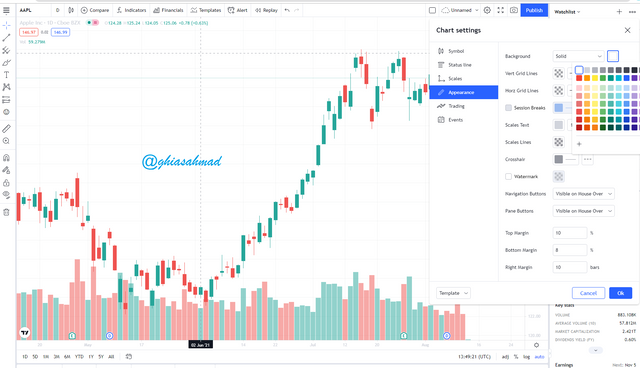
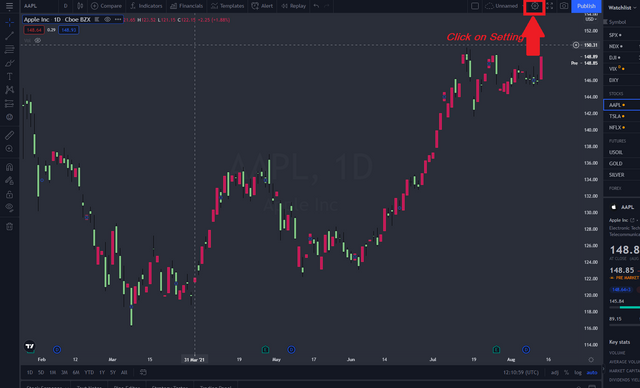
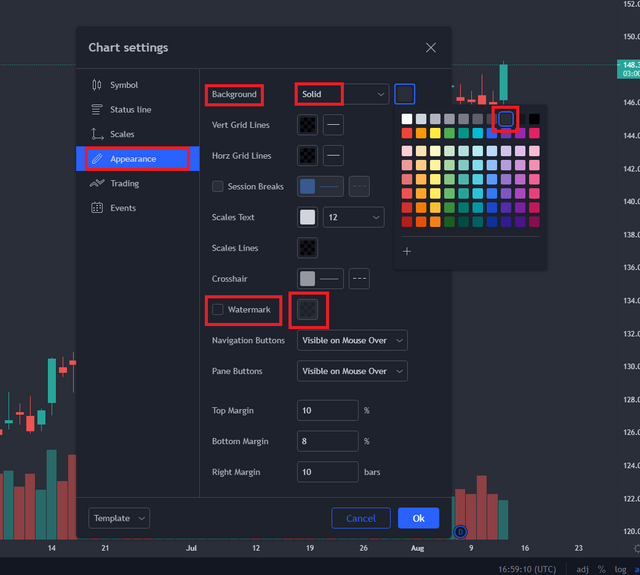
If you want to change the background of the chart click on the settings button that is found in the right upper corner. As you are looking in the screenshot.
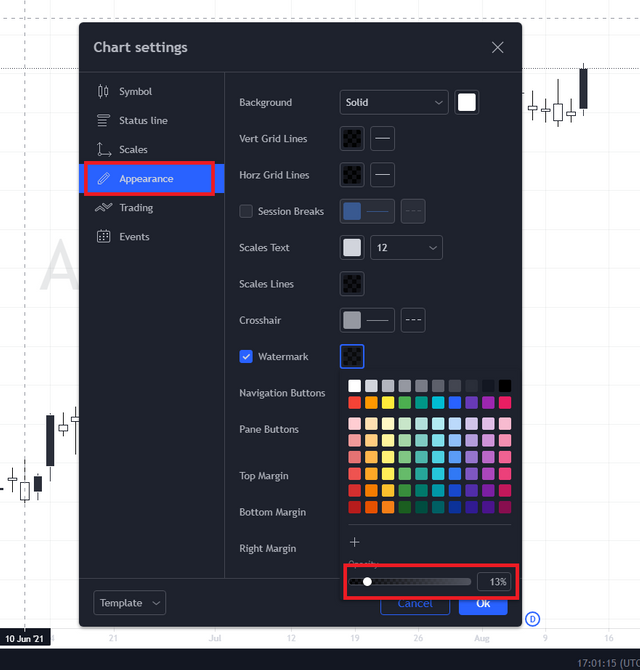
A new box will be open with many options out changing the color of indicators and color of chart background. To change the background of your chart click on the equal button mostly have black color. After clicking on the button you will see many colors and here you can select the color which you want.
If your favorite color is not here then click on the + sign that is below these colors. You will see a table of mixed colors then select your color and set it on the chart background. After selecting the background you will see an option of "watermark". If you will click on this option a watermark will appear on your chart screen about the stock that you are analyzing.
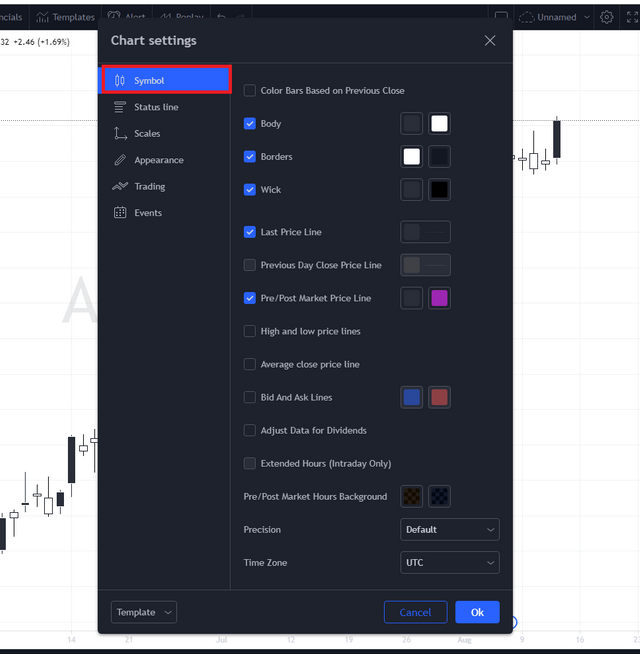
For changing the color of candles click on the candles according to the screenshot.
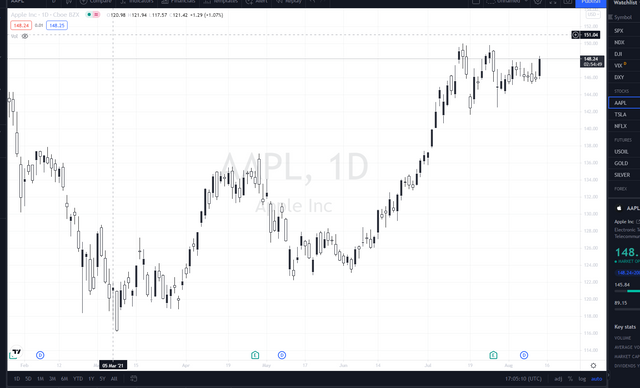
Result after Changing
This is the final picture after changing the graphs of the chart. You can see my changes that are looking in the screenshot.
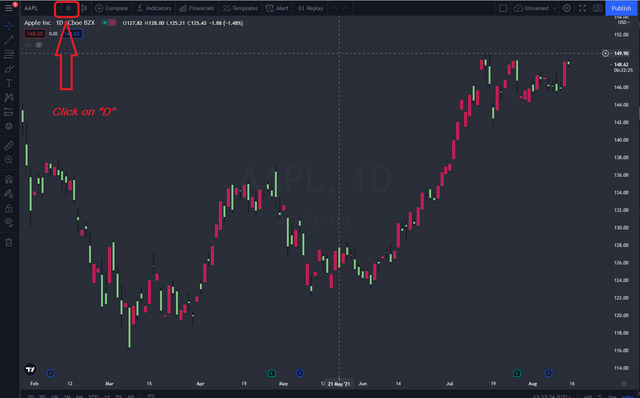
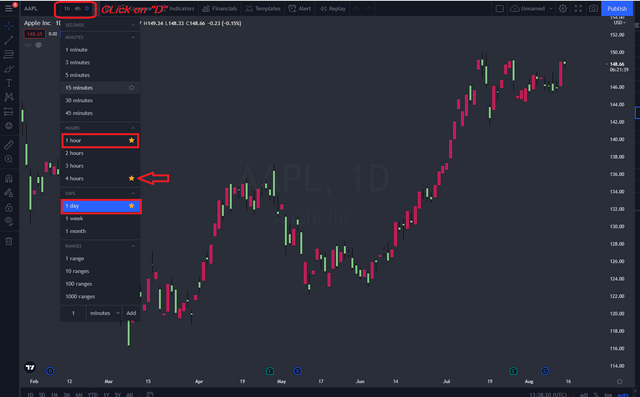
We can also set the time period in the chart. For this purpose, click on D as looking in the screenshot.
You will see a table of times so click on the time which you want to see. You can also add time to your favorite. For this purpose scroll your pointer to the other side of time and then you will see a star. Click on the star and your time is added to most viewed or favorite. This is so inspiring trick.
How to use tools in trading view? This is so simple and I will tell you some trading tools that help traders to analyze the trading charts. So, let's start our work.
First Tool of Chart
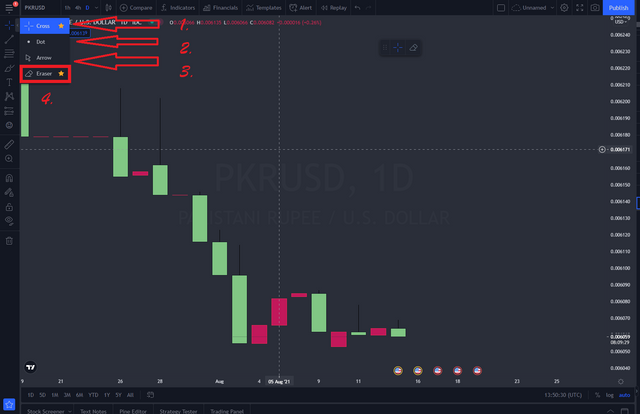
The first tool of this chart was used to change the central point of horizontal and vertical lines. As I clicked on this and I see four more tools. The first tool is a cross-tool that use to analyze the market by horizontal and verticle lines. This is the most famous tool for traders and most traders use this tool.
Now I want to tell you about its setting features.
First of all when you will click on the first toll than a chart of more tools.
- The first tool of this chart is cross-tool. This tool uses to show horizontal and vertical lines. This is a most used tool. In the center where two lines cross each other, we can see a sign that looks like a sign of plus + in the cross.
- The second tool is a dotting tool ad and this tool has a dot where two lines (Horizontal, Verticle) cross each other.
- The third tool is an arrow and when we click on this then horizontal and vertical lines be removed from the chart.
- The fourth tool is an eraser and this tool use to remove trading lines and other extra analysis activities.
Second Tool of the Chart
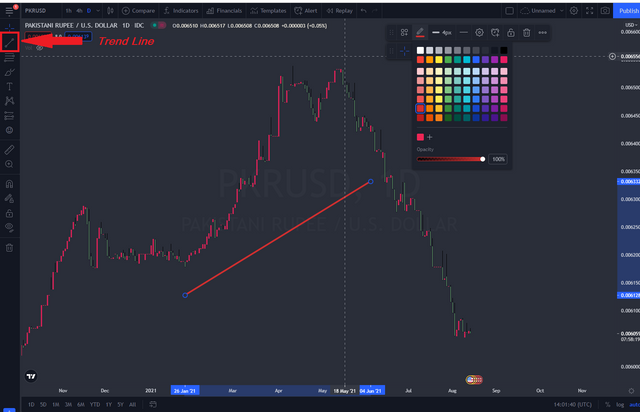
The second tool that I want to explain is trend lines. This tool uses to analyze to stock market up and down. This is also so useful and so interesting tool and almost all traders use it for trading.
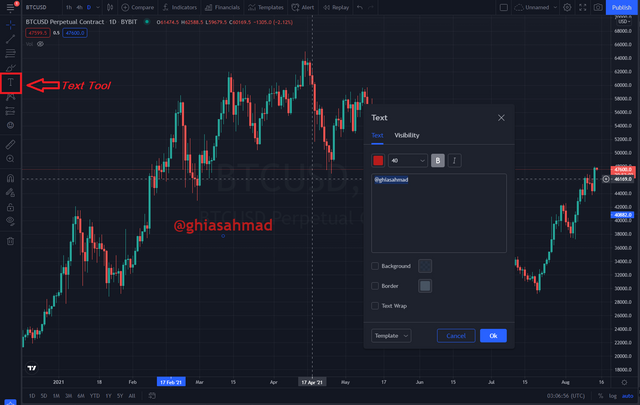
Choose text from the toolbar as you are looking in the screenshot and this tool uses to add a watermark to your text. Click on the tool and a box will be open then enter your text that will appear on the chart.
Question Number 4.
Explain how to add indicator in the chart, what is your favorite indicator and why? (screenshot necessary)
How to add indicators on the chart? This is also so simple and so easy way to add indicators to the chart.
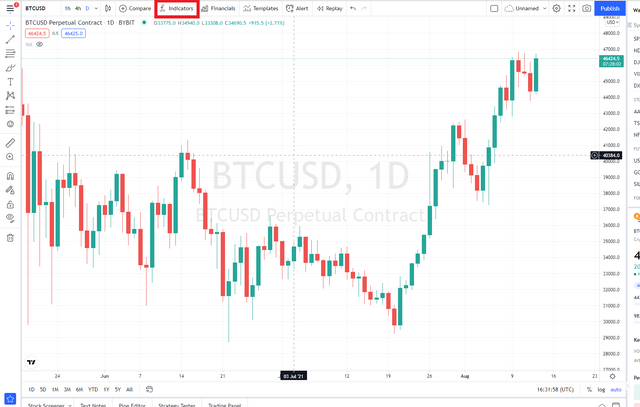
- First of all click on the indicator option that is looking on the upper bar of your chart and then a page will be open.
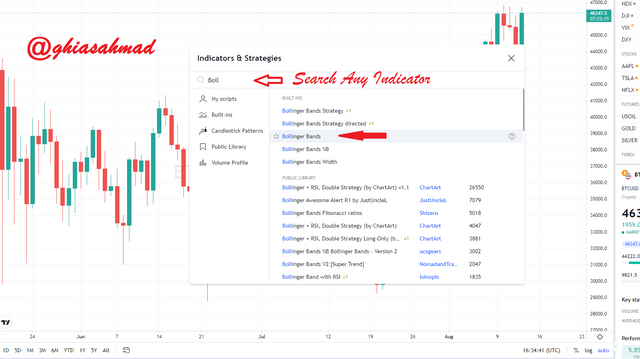
- Enter your favorite indicator or the indicator which you want.
As I entered "Bolling Bands". So, you can use any indicators.
.png)
Second Part of Question

What is your favorite chart and why?
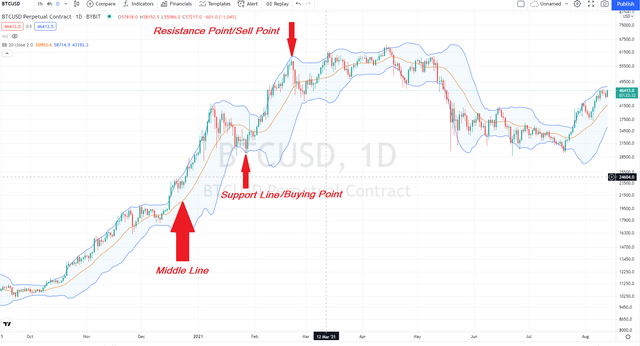
My favorite indicator is "Bolling Bands" indicator because this is so useful and so interesting. It appears three lines. The first line looks on the top of the candles, the second line looks in the center of the candles and the third line looks down from the candles. These lines have particular functions. It has two main points. One is called resistance point and the second is called support point. If graphs cross his resistance point then it will be going up and if graphs cross his support point then it will go down. So, this is a useful indicator and it is useful to predict future stock value.
.png)
Question 5.
Do you think TradingView is useful in predicting the market for cryptocurrency (trend / price)?
.png)
My personal point of view about this site.
- This platform has many functions that help the traders to analyze livestock exchange in the market. This is such a trustable platform. we can also analyze the market using Fibonacci retracement that use to predict stock exchange in the future.
- Its chart is also so helpful in this prediction because the chart shows us live to trade and we can analyze sock trading to see candles moment.
- Its tools are also so helpful in this case who help us to analyze market moment.
So, by these senses, I come to the conclusion that tradingview.com is helpful to predict the market in the future.
Conclusion
After using and analyzing this platform I come to the conclusion.
- This site is so useful for traders and beginners who want to learn about crypto trading. It is so easy to use this site and any common man can understand it easily. This is the best platform to analyze the market of any currency and this is very popular among traders. Trading views have basic tools and features that I explained. These tools are the basic tools that can help traders to analyze the market from different points of view.
- This site has a service of free account creation and by this service, any common man can access the stock market chart. Its most important feature is its free account creation.
- Its indicators and tools are so helpful to predict the market in the future. Its indicator increases the quality of analysis and makes it easy to use for the trader. It has easy accessing features as a watch list. We can add our favorite currencies to the watch list to access easily. It means that this is so useful and helpful platform. With all of this explanation, I come to the conclusion that this is so useful and so helpful site for traders and especially, beginners can take it easy. This is an easy platform to understand cryptocurrency market moments. So, this is really helpful and easy in my point of view.


Respected first thank you very much for taking interest in SteemitCryptoAcademy
Season 3 | intermediate course class week 7
you tried best thank you very much for joining this class
Dear @yousafharoonkhan,
Thanks a lot of dear professors. You checked my assignment and I will try my best to prove it next time.