Crypto Academy Season 4-week 2 | Homework post for professor for @reddileep I Heikin-Ashi Trading Strategy
Assalam-o-Alaikum!
1- Define Heikin-Ashi Technique in your own words.
Answer Question Number One
Heikin Ashi is a technique that is used to identify trends easily and this technique was introduced by the Japanese. Heikin Ashi candles were discovered by Munehisa Homma in the 1700s and Heikin Ashi is a combination of two Japanese words Heikin and Ashi. Heikin means Average and Ashi means Bar and it means that average bar. Heikin Ashi candles are the same as a normal bar but these are the average of the normal sticks so it is called average bar.
In Japanese common candles do not use any information and calculation before predicting the next candles but in Heikin Ashi candles are represented by previous candles by a specific formula by analyzing them close, open, high, and low prices. The Heikin Ashi chart uses a two-period average-based formula and it gives that smoother appearance to the chart to make it easier to analyze. The Heikin Ashi chart mainly uses to show general trends of the prices and to show the strategy to each trend. When compared to the Japanese traditional chart, the Heikin Ashi chart slows down to the speed to market and remove false and unnecessary signals and indicators which makes it more reliable to price action analysis but it has also some disadvantages as it smooths to prices therefore they close and opens late it means that if a trader can be late in trading because of its slow speed and will give up to unrealized profits. So, it has also some disadvantages but on the other hand when we see its advantages that are more from its disadvantages.
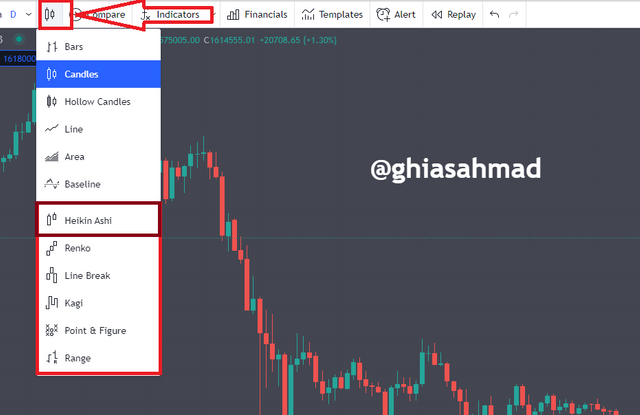

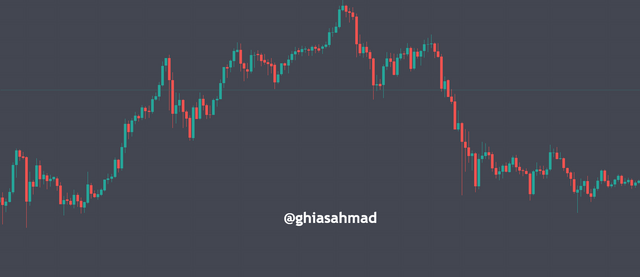
2- Make your own research and differentiate between the traditional candlestick chart and the Heikin-Ashi chart. (Screenshots required from both chart patterns)
Answer Question Number Two
| Heikin Ashi Chart | Japanese Traditional Chart |
|---|---|
| Heikin Ashi's chart shows candles because it essentially takes an average of the moments rather than expected prices. | The Japanese Traditional Chart shows many useless signals that make many problems for traders to analyze. |
| The color of the candles change when then the market changes trend | Minor change in the market can change the color of candles |
| Candles start from the middle by the previous candle. | Most of the traditional candles start from the place where previous candles close. |
| It is smoother with green bars | This is not smoother. |
| These are literal | These are not literal |
| It shows smoother bars with green and red candles and shows specified data. | It shows raw data through green and red candles (generally). |
| Its graph looks so smooth and so beautiful. | Its graph looks very complicated because of volatility and also looks noisy. |
3- Explain the Heikin-Ashi Formula. (In addition to simply stating the formula, you should provide a clear explanation about the calculation)
Answer Question Number Three

As Heikin-Ashi uses 4 types of data so we will use formulas through data.
- Open
- Close
- High
- Low
- Now I will tell you how to calculate open.
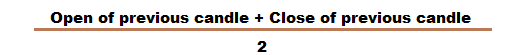
We will take the addition of previous candles and close previous candles and will divide them into two.
Open= Open of previous + Close of previous candle/2
- Now I will show you how to calculate close.
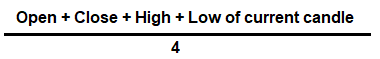
In this case, the candle's open, close, high, and low points are added and then their sum is divided on four.
Close= Open + Close + Hight + Low of current candle/4
Now I want to tell you about the High and low of Heikin-Ashi candles but first I wanna tell you that Heikin Ashi low and high are equal to the High and Low of the normal candle.
- Calculate to High
High is equal to the maximum value of the high, open, and close of the normal candles in the chart.
High= Max.[High, Open. Close]

- Calculation of Low
Low is equal to a maximum value of low, open, and close of the normal candle.
Low= Minimum[Low, Open. Close]

4- Graphically explain trends and buying opportunities through Heikin-Ashi Candles. (Screenshots required)
Answer Question Number Four
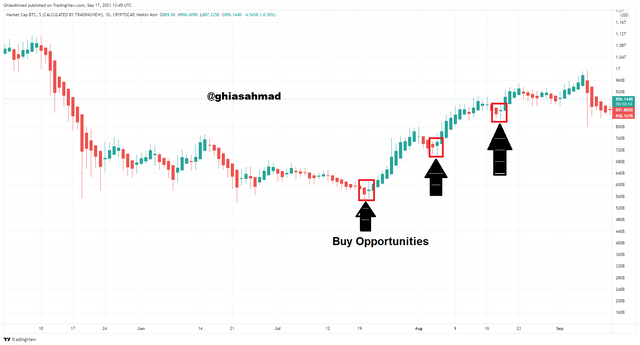
- Now I will discuss the trend and the buying opportunities with Heikin-Ashi candles.
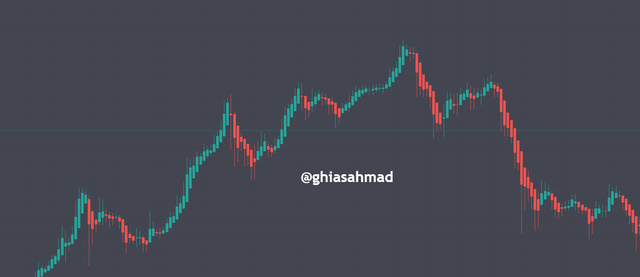
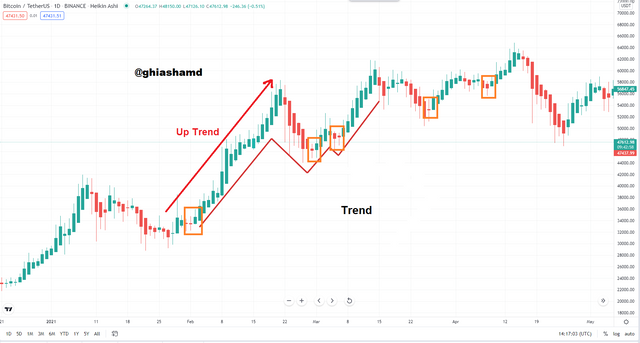
Heikin Ashi goes into the buying trend when marketing quickly goes uptrend but here is the situation because Heikin Ashi is different from traditional candle trading so here trade should be applied after deep analysis. The Heikin Ashi chart shows trends when the market constantly changes and gives a sequence of the candles as given in the screenshot. The market shows trends but here should be alert because sometimes the market shows minor changing signals that do not matter but those signals confuse traders so should be alert from these signals.
Uptrend (Bullish Trend) was created when then the market moves up quickly to take strong support and this considers a strong path for buying for buyers.
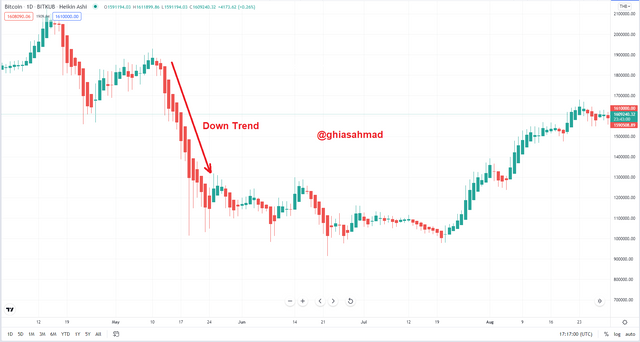
In the case of a downtrend (Bearish Trend), the market moves down to take a strong resistance and makes many candles of a downtrend. This is called a strong trend and this may consider a good path for sellers.
- Buying Opportunities
5- Is it possible to transact only with signals received using the Heikin-Ashi Technique? Explain the reasons for your answer.
Answer Question Number Five
Yes, It is right that the Heikin-Ashi candle chart can help to improve analyzing and trading in the market and it also decreases extra and wrong signs in the chart. It also gives more opportunities in the chart to trade. Anyway, it is so useful in trading but it is completely wrong to say that it is 100% correct and it will always prove profitable for the trader.
When it is applied correctly then certain success can be achieved but in the case of using it incorrectly. Many indicators can be used with Heiken Ashi for improvement in trading and it makes trading more secure because sometimes it shows wrong signals in the market which causes confusion for traders. But on the other hand, it helps traders to understand trading. I suggested that other indicators and signals should be used with Heikin Ashi which will make it to trading
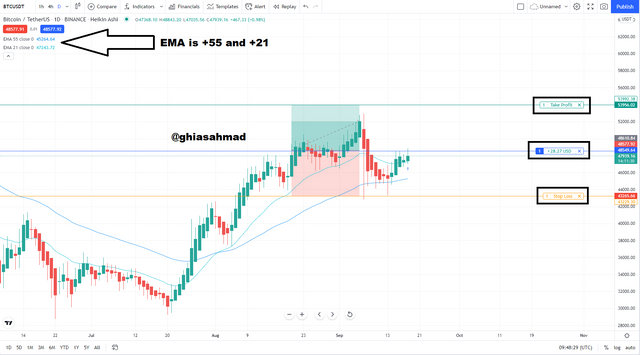
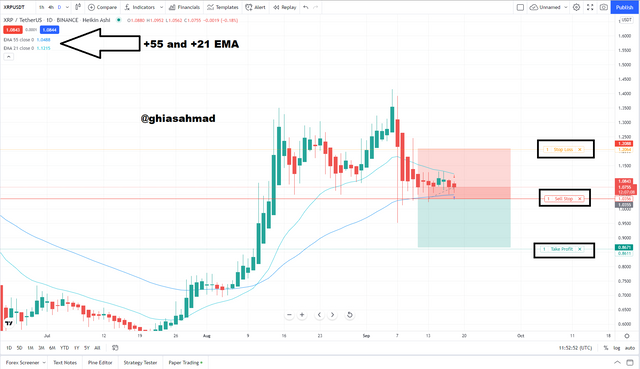
6- By using a Demo account, perform both Buy and Sell orders using Heikin-Ashi 55 EMA+21 EMA.
Answer Question Number Six
Heikin Ashi shows buying opportunities when the market continuously moves and does and makes a sequence of trading. Here we will discuss it with the previous screenshot. you can see that the market moves up and down, then it makes a sequence of candles. A trader can apply to buy when the market starts to move up and to give a particular signal and Now I will trade with 55 EMA and 22 EMA. But it wants to tell you that 55 EMS have the most use in trading.
- Trade order Buy
- Trade order Sell
Conclusion
After completing this task I come to the conclusion that Heiken-Ashi is one of the best and useful charts to analysis and this may help to deep analysis. If anyone learns it deeply and becomes an expert in EMA, he can be achieved certain success in trading. However this is so useful in crypto trading for all traders moreover, it is too easy to analyze it.