Trading using Wedge Pattern- Crypto Academy / S5W5 - Homework Post for Prof @sachin08
INTRODUCTION
Greetings guys, I hope you are all doing well. It's a great pleasure taking part in this task given to us by @sachin08 which is about wedge patterns. Below is my submission.
1.Explain Wedge Pattern in your own word.
WEDGE PATTERNS
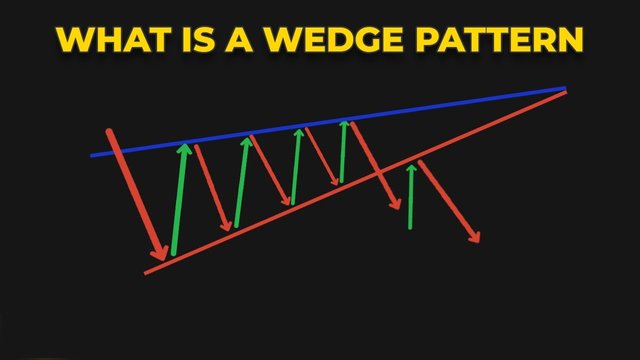
A wedge pattern can signal a strong reversal trend which can either be bullish or bearish after the occurrence of a breakout. The breakout from either the resistance or support lines (the upper and lower converging lines) provides traders with both entry and exit positions.
Wedge continuation or reversal patterns are sometimes very difficult to recognize and can be formed at any point on the cryptocurrency chart depending on the market trends. There are actually two types of wedge patterns, namely; Rising wedge and Falling wedge.
2.Explain both types of Wedges and How to identify them in detail. (Screenshots required)
RISING WEDGE
A rising wedge pattern is a technical indicator that signals a bearish trend when a trading range contracts over time but features a decisive slope upward. This means that both the subsequent highs and subsequent lows within the wedge pattern will be shooting upward as the trading range gradually narrows or converges towards a single point of the wedge known as the apex.
Rising wedge patterns are typically formed at the end of an extremely bullish trend and indicates an imminent breakout to either the downside or the upside of the chart (reverse or continuation). As the wedge forms, the asset price ought to be making higher highs and higher lows (resembling a saw tooth pattern or a slice of pizza).
HOW TO SPOT A RISING WEDGE
Accurately identifying a rising or an ascending pattern in a cryptocurrency chart is very challenging sometimes even for professional traders, but with the aid of some principles which I am going to list below, you can recognize them without stress.
As a first step, you should notice the presence of a prior trend. Understandably, an ascending wedge needs to reverse an existing trend. A rising wedge pattern usually forms across the span of a 3-6 months period and usually marks a medium or long term trend reversal.
After identifying the prior trend in the chart, the next step is to draw an upper resistance line connecting at least two or more highs. Each high should appear higher than the previous one on the chart.
Also, you are required to draw a lower support line connecting at least two or more lows, each of which should be higher than the previous one.
Additionally, you should make sure that the drawn resistance and support lines move towards each other and converge at the end as the pattern progresses or matures. There should also be a decrease in volume as the price increases towards the right before a breakout from the pattern occurs (mostly through the support line).
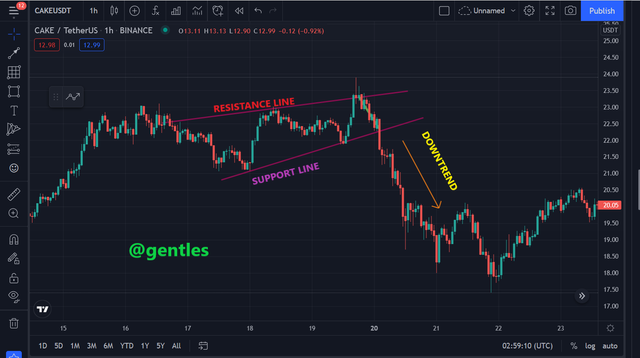
The above screenshot of the cryptocurrency pair CAKE/TetherUS taken from tradingview describes exactly how a rising wedge pattern should appear to traders before risking their capitals. An extreme price movement analysis was made to determine the number of higher highs and higher lows made by the wedge as it progressed along the way.
An upper resistance and a lower support line were drawn to connect the highs and lows on the chart with each high and low greater than the next indicating a decrease in the price volume.
A strong breakout from the pattern occurred downwards through the support line providing an entry position for traders to earn profits.
FALLING WEDGE
A falling or a descending wedge is the inverse of a rising wedge, meaning it occurs when the asset price is moving in an overall bullish trend. It begins wide at the top and contracts downwards over time. Falling wedge features a decisive slope downwards allowing the reaction highs and reaction lows to iterate between the higher resistance and the lower support lines.
Falling wedge patterns are typically formed at the end of an extreme bearish trend and indicates an imminent breakout to either the downside or the upside of the chart.
HOW TO SPOT A FALLING WEDGE
Identifying a falling or a descending pattern in a cryptocurrency chart is difficult sometimes even for experienced traders, but with the aid of the below guidelines, you would be able to spot them easily.
The first step you should consider is the presence of a prior trend. Understandably, a descending wedge pattern needs to reverse an existing trend. It usually forms across the span of a 3-6 months period and mostly marks long term or intermediary trend reversals.
After identifying the prior trend in the chart, the next step is to draw an upper resistance line connecting at least two or more highs. Each high should appear smaller than the previous one on the chart.
Also, you are required to draw a lower support line connecting at least two or more lows, each of which should be lower than the previous one.
In addition, you should make sure that the resistance and support lines you have drawn move towards each other and converge at the end, as the pattern progresses or matures.
Lastly, look for a breakout above the higher resistance line for a long entry position.
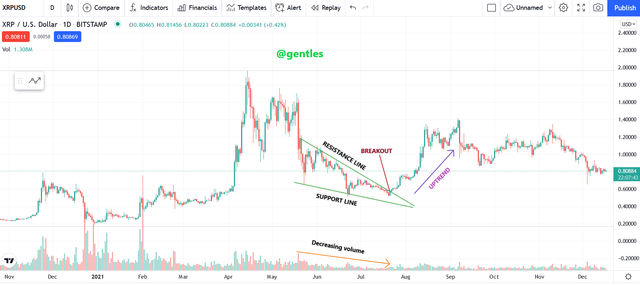
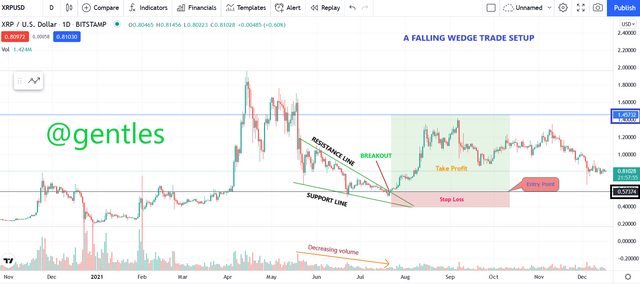
The above screenshot of the cryptocurrency pair XRP/U.S. Dollar taking from tradingview describes exactly how a falling or a descending wedge pattern should appear to traders before intending to risk their capitals. An extreme price movement analysis was made to determine the number of higher highs and higher lows made by the wedge as it progressed along the way.
An upper resistance and a lower support line were drawn to connect the highs and lows on the chart with each high and low greater than the next indicating a decrease in the price volume.
A strong breakout from the pattern occurred upward through the upper resistance line providing an entry position for traders to earn profits.
3.Do the breakout of these Wedge Patterns produce False Signals sometimes? If yes, then Explain how to filter out these false signals.
The answer to the question above is always going to be YES regardless. This is simply because technical indicators including wedge patterns can only aid traders in the cryptocurrency world to predict the possible directions of trends or signals of a price asset but can not be totally depended on since they are not hundred percent accurate.
The cryptocurrency market produces false signals sometimes thus, it breaks through an obvious level and suddenly changes direction which leads to maximum losses even with the help of upper resistance and support line to connect the highs and lows produced by the trends. This is actually the main reason behind the use of multiple indicators by professional traders to make perfect trading decisions.
Some of the effective and popular indicators you can use as a trader to validate or confirm developed wedge pattern signals are as listed below.
Relative strength index (RSI): RSI can help you not only to recognize or identify oversold and overbought conditions matured for cryptocurrency price reversals, but it can help you to measure the strength of price reversals as well.
Moving averages (MA): It aids traders to verify or confirm the price reversals of a currency pair when it crosses over the moving average indicator (from simple averages to exponential averages).
Bollinger bands: It is used to properly detect price reversals or opportunities that provide traders with a higher possibility to identify overbought and oversold signals in charts. It also enables traders or investors to determine both exit and entry points for a trade.
HOW TO FILTER OUT FALSE SIGNALS
To be frank, filtering out false signals on a cryptocurrency chart is not easy. If it was, a lot of traders would be able to identify it and make more profits. However, traders can simply deal with such situations by employing different indicators to verify the signals produced before executing trades.
False breakouts can also be filtered out by using the 3% rule. Thus traders need to make sure that the price of their assets rises above the resistance line by 3% to verify a breakout.
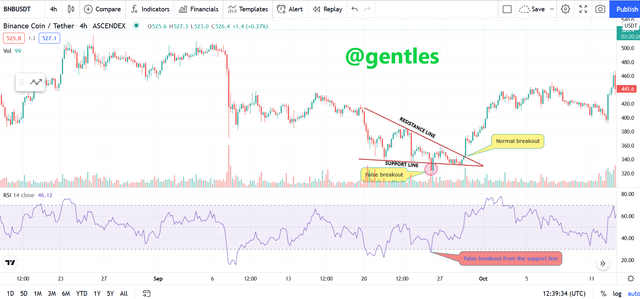
Below is an example of a false breakout which I confirmed with an RSI indicator.
From the image of BNBUSDT above, you can clearly observe that a false breakout occurred from the falling wedge pattern through the lower support line and changed its direction back into the pattern. Before concluding as to whether the signal is legit or fake, I introduced an RSI indicator to confirm the signal as seen in the chart.
4.Show full trade setup using this pattern for both types of Wedges. ( Entry Point, Take Profit, Stop Loss, Breakout)
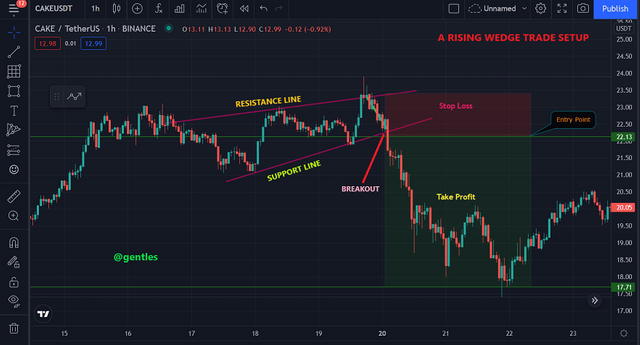
From the above image of CAKE/TetherUS pair taken from tradingview, I drew an upper resistance and a lower support line to connect the highs and lows on the chart with each high and low greater than the next indicating a decrease in the price volume. A trade setup was then executed immediately after the occurrence of the breakout through the support line. Thus; I placed an Entry point at exactly 22.13 USDT with my Take profit slightly placed below the support line and the Stop loss above the resistance line.
From the above image of XRP/U.S. Dollar pair taking from tradingview, I drew an upper resistance and a lower support line to connect the highs and lows on the chart with each high and low greater than the next indicating a decrease in the price volume. A trade setup was then executed immediately after the occurrence of the breakout through the support line. Thus; I placed an Entry point at exactly 0.57374 USDT with my Take profit located just above the resistance level and the Stop loss below the support line.
CONCLUSION
Wedge technical indicator patterns are typically reversal patterns that can be either bearish or bullish (a rising or a falling wedge). These patterns can be extremely difficult to identify and interpret on a cryptocurrency chart because of their resemblance to triangle patterns. It is therefore important to be very careful when trading wedge patterns. Also, remember to use the trading volume as a means of confirming the occurrence of a breakout.
I encourage anyone reading my post to open a demo account and practice trading the falling and rising wedges. This way, you will get more acquainted with different trading approaches and be better prepared to trade your own assets or capital in live markets at a later stage to earn maximum profits.
Cc:
@sachin08
