Steemit CryptoAcademy | Season 3 Week 7 | Homework post for prof.@ yousafharoonkhan | How to create an account on TradingView, how to use indicators,tools, features of tradingview
Hello Prof.@yousafharoonkhan, thanks for this lecture on TradingView. I learned a lot
Define the TradingView site and how to register an account on TradingView? What are the different registration plans (screenshot required)
Trading view is an analysis platform that is used for trading assets. It has a lot of tools, features, and functions that are needed by traders to aid them in the trading analysis. Cryptocurrency, stock, forex, commodities, bonds, etc, and all other forms of assets can be analyzed on the platform. This makes it a universal trading analysis tool.
To have full access to all the trading tools and other features on the platform, traders have to create an account to perform technical analysis on assets before and during their activities like selling, buying, or brokering
How to register an account in TradingView?
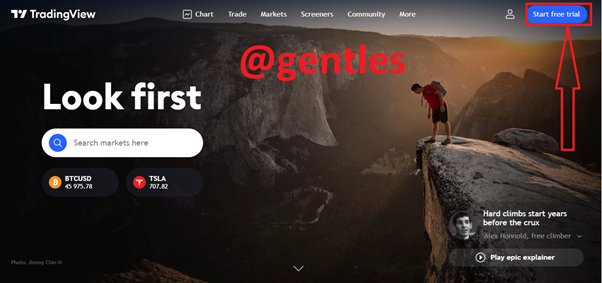
To access their website, enter TradingView. After loading the page click on Start free trial.
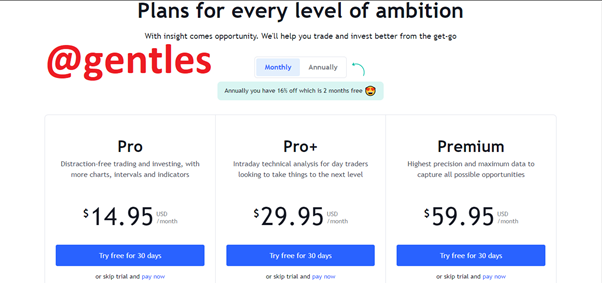
The following page will load afterward. It can be seen from their page that Trading view has various starter plans; basic, pro, pro+, and premium each of them has its own price every month. You can decide to select the free trial option to first learn more about the platform before and if you are interested you purchase your preferred account plan.
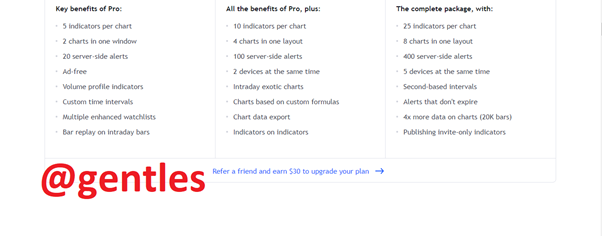
The Pro version is priced at $14.95. Its benefits are as follows: users can use five indicators in one chart, two graphs in one window, it is advert-free with 20 price alerts. It also comprises volume profile indicators. Line intervals can be customized, users can also monitor multiple assets, and also allows intraday bars to be replayed.
The Pro + version is priced at $29.95 and it allows ten indicators in a chart, users can also open four graphs in one layout and it also allows 100 price alerts. It also allows two devices to be used simultaneously, intraday exotic charts are available, graphs based on customizable formulas. Data on the chart can also be exported and users can set indicators on indicators.
The Premium option is priced at $59.95. It offers benefits such as 25 indicators in a graph, on one screen users can add 8 charts and 400 unlimited alerts. The account can be used on 5 different devices at the same time, it enables real-time (in seconds) analysis of charts, users enjoy four times more data with about 20k bars.
The plans can be paid for on yearly basis, it comprises the same plans with the same benefits but users can enjoy 16% off the price which is about two months free.
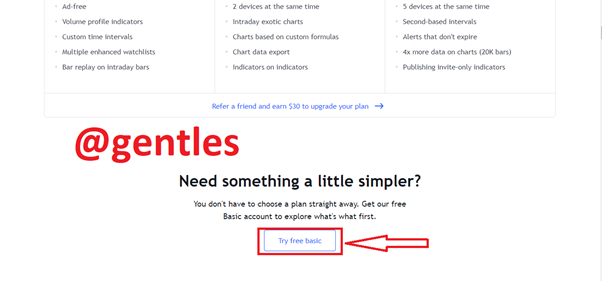
For users who cannot afford any of the plans or a trader who wants to it out can choose the free option. Just scroll down a little bit on the page and click try free basic. This plan is a trial version, its features are limited. With the free plan, only 3 indicators can be used on the chart at the same time. However, this plan should be enough for traders who are just taking their first steps in trading.
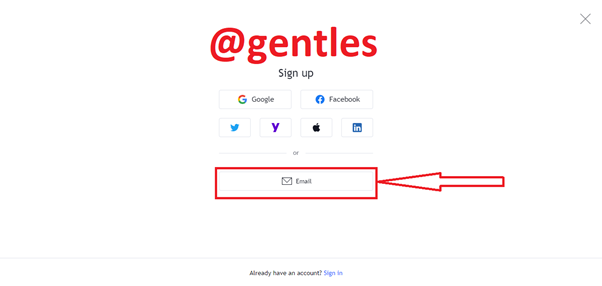
It can be seen below that the account can be registered with other accounts such as Google, Facebook, Twitter, yahoo, apple account, and Linkedin. But we can only choose one, I will be opening mine with my email.
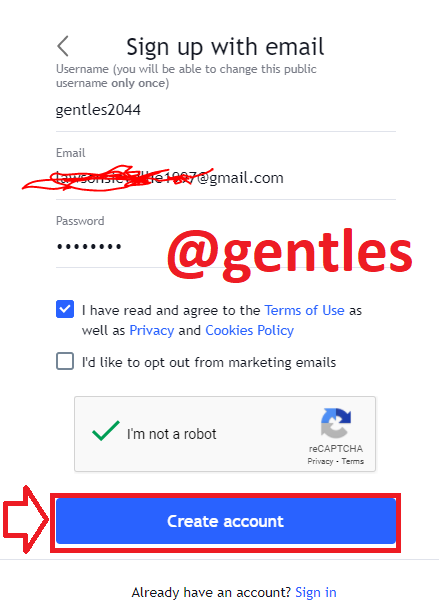
Enter your preferred username, email, and password. Tick the I have read and agreed to the terms of use box and solve the captcha and click on the create account button.
After this process a link will be sent to your email account for you to confirm your account, you will then be redirected to your trading view account to enter your name and add a profile picture. Then click on continue.
The account will be opened with your username and you will have to log in with your email and password anytime you want to sign in.
The platform has many functions and features that aid in the trading experience. Let’s have a look at some of them;
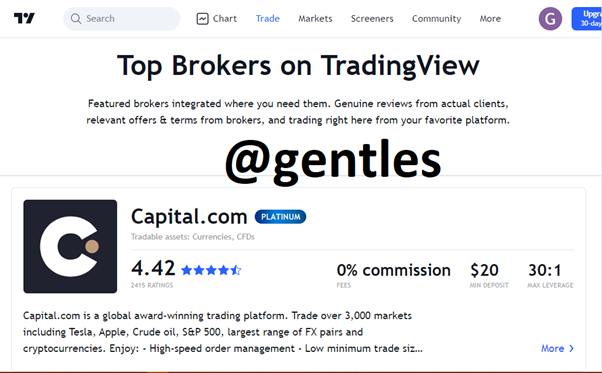
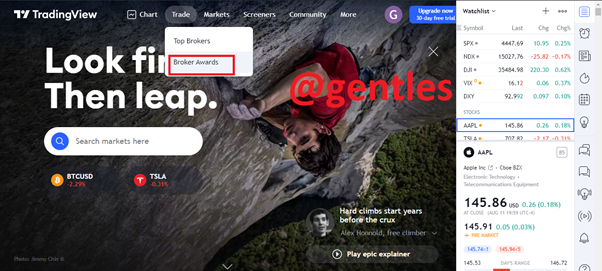
If you click on the Trade at the top menu, you will find options like Top brokers and Brokers awards.
Top brokers show a list of the best brokers on the platform according to their ratings.
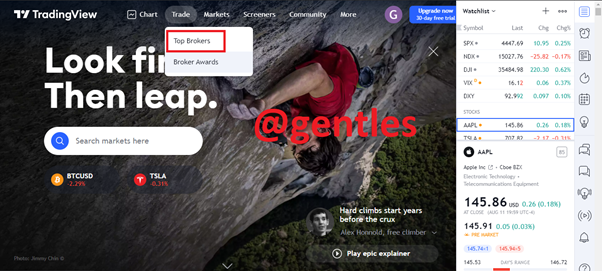
The Broker Awards show the best brokers that are being given awards on the platform. These brokers are awarded by the review or votes of the users of the platform.

The platform has other features for analysis
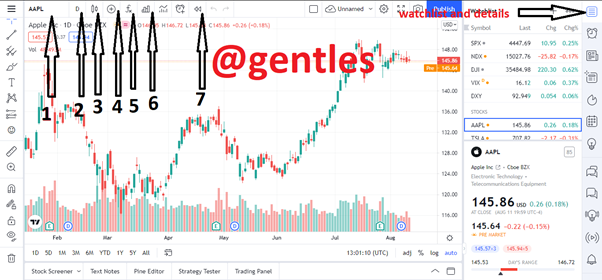
Symbol search (1): this option allows users to search for their preferred asset trading pair which is displayed immediately after the search.
Timeframe (2): this option allows users to trade in the time frame of their choice. These time frames could be seconds, days, and so on
Candles feature (3): This option gives a type of Japanese candlesticks which are most used in trading graphs for price action. When the feature is opened, it presents a variety of other options like lines, bars, hollow candles. At default, Candles are the chart display feature and it is very easy to use in analyzing chart data.
Compare feature (4): this feature aid users to compare other trading pair graphs to the current chart. For instance, you can compare the BTCUSD chart with the ETHTRX chart. Click on it, choose the chart you want to compare with the current one and the two charts will be shown so you can compare them easily.
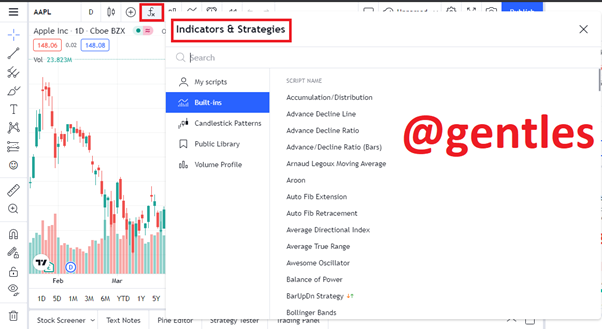
Indicators and Strategies (5): this option gives users access to the indicators and strategies available on the platform. Open it, search for your preferred indicator and it will be displayed for you.
Fundamental metrics for stocks (6): this feature is for stock traders; it shows some basic measurement tools for stock trading.
Bar replay (7): it allows users to replay the bars like how they happened in the past.
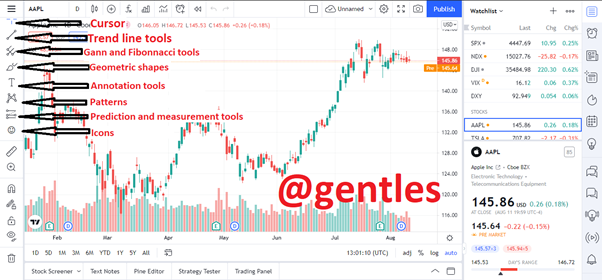
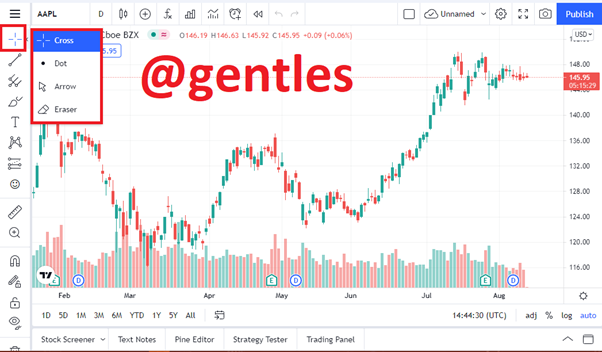
Cursor: in this feature, there are various options like dot, arrow, eraser. The one at default is cross, it allows users to easily see the price at the right and date or time at the bottom on any part of the chart.
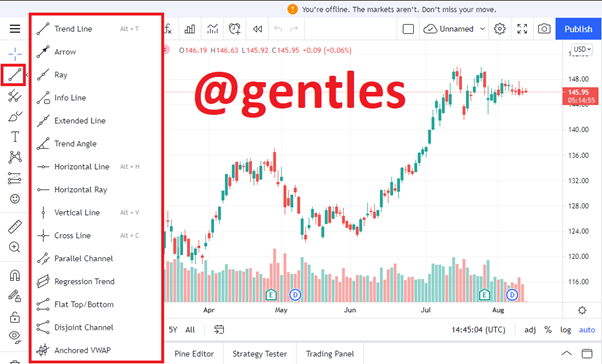
Trendline tools: this feature comprises various trend lines like trend line, Arrow, Ray, Info Line, Extended Line, Trend Angle, Horizontal line, Horizontal ray, Vertical line, Cross Line, etc.
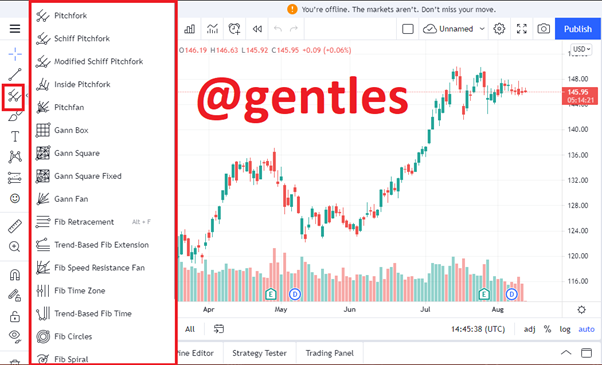
Gann and Fibonacci tools: this option has options like the pitchfork, Schiff Pitchfork, Modified Schiff Pitchfork, Fibonacci retracement, Gann Box, etc.
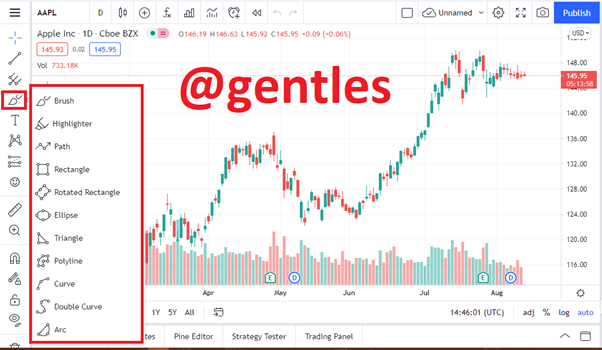
Geometric shapes: various shapes and geometric features are available here for trading analysis. It has features like triangle, ellipse, highlighter, brush, curve, etc.
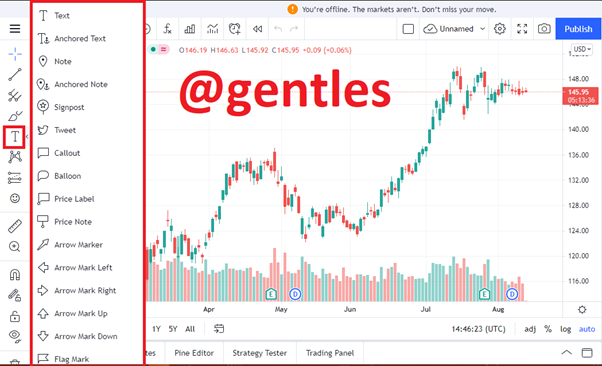
Annotation tools: this feature allows users to use texts in their trading analysis some of the sub-options are text, signpost, balloon, tweet, callout, etc. They can be used in marking certain important points on the chart with a text. For instance, the text feature allows users to write on the chart.
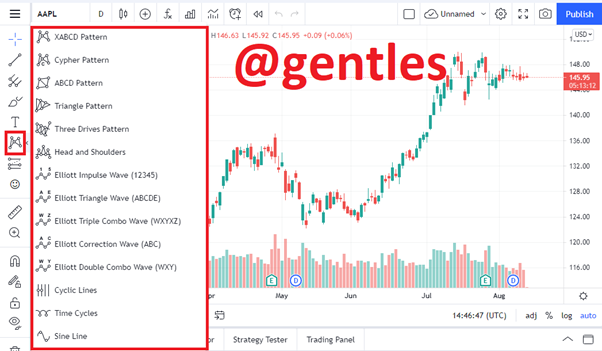
Patterns: users can draw any pattern of their choice using this tool. Some of the sub-options are, single line pattern, cypher pattern, XABCD pattern and so many other options.
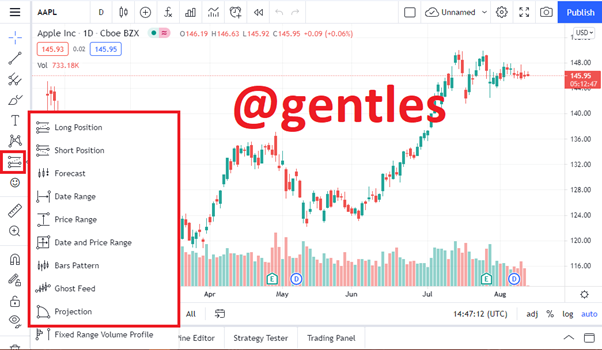
Prediction and Measurement tool: this option contains long position, short position, forecast, date range, price range options, and so on.
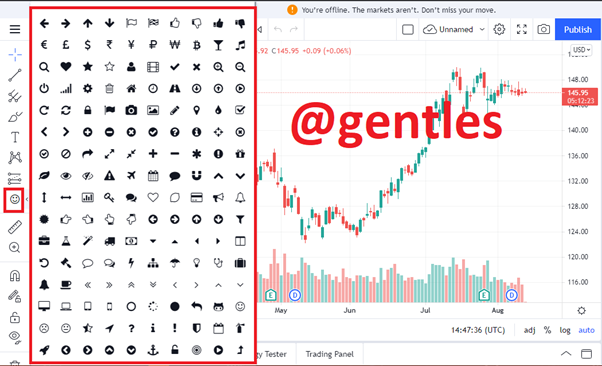
Icons: this option adds figures to the chat that shows special areas in the chart to watch out for. They are in the form of different shapes, warning icons, and so on.
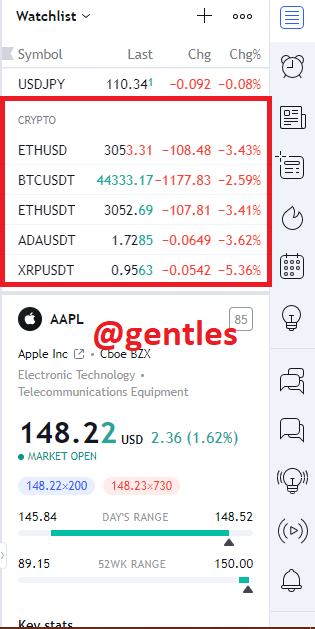
Another interesting feature is the watchlist feature, which is located at the far right of the page, it enables users to configure an asset monitoring list, which makes users aware of their price changes. If you want to add a watchlist click on the plus (+) sign.
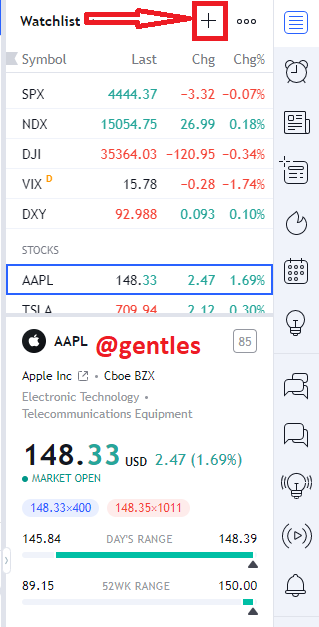
Then a text box will appear where you can search for the assets you want to put on the watchlist. Click on the plus sign right beside the asset to add it to the watchlist.
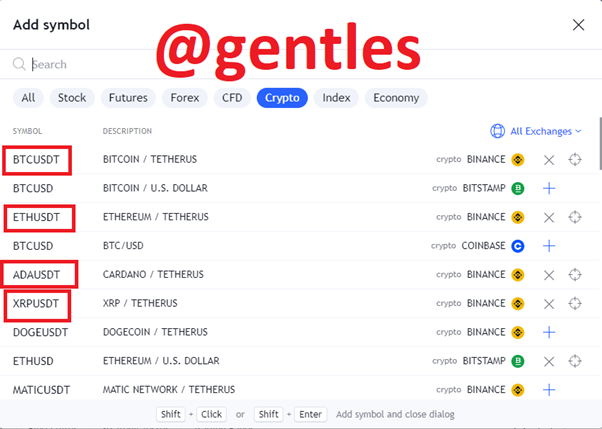
The assets I chose were BTC/USDT, ETHUSDT, ADAUSDT and XRPUSDT.
The indicator feature is my favorite, it has different trading indicators that can be added to your chart for example accumulation distribution, average directional index, Oscillators, Relative Strength Index (RSI), Parabolic SAR, etc. All the indicators for technical analysis in trading are available in this feature and that is why it is my favorite.
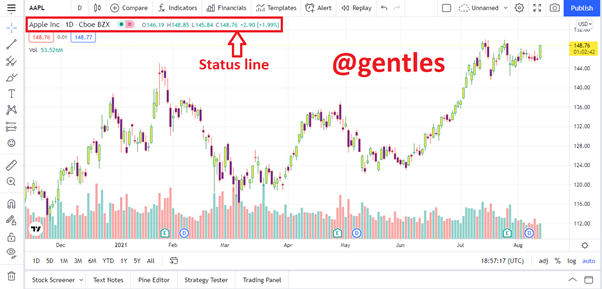
How to set up a chart in TradingView and use two tools to edit it (screenshot required)
To set up a chart, right-click on any part of the chart and select settings.
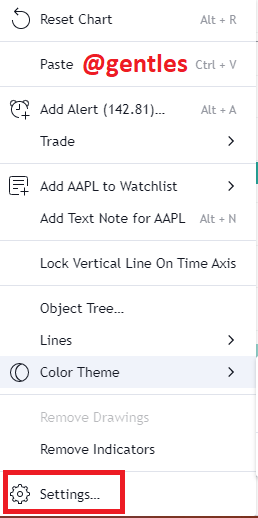
The chart settings window will open.
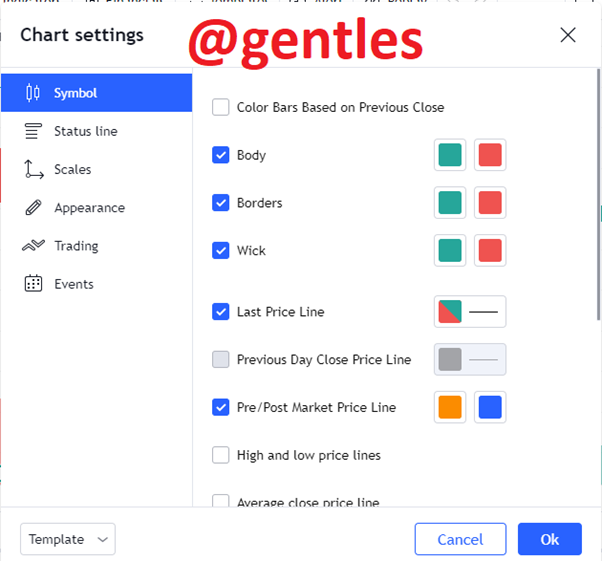
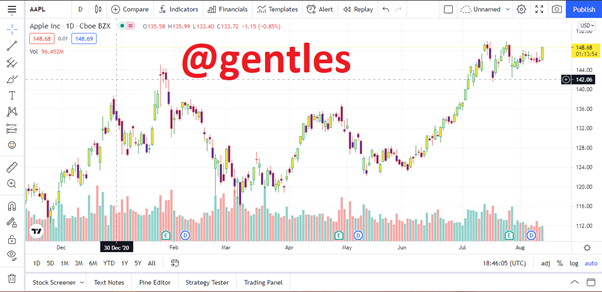
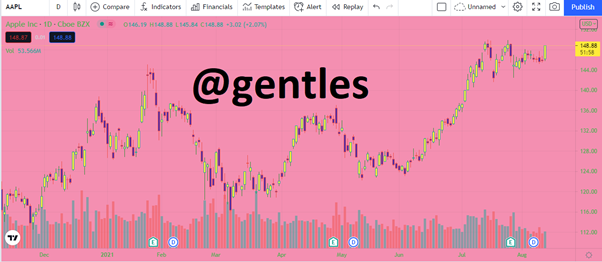
I changed the colors of the bars from the symbol settings, changed the bullish bars to yellow and the bearish to purple.
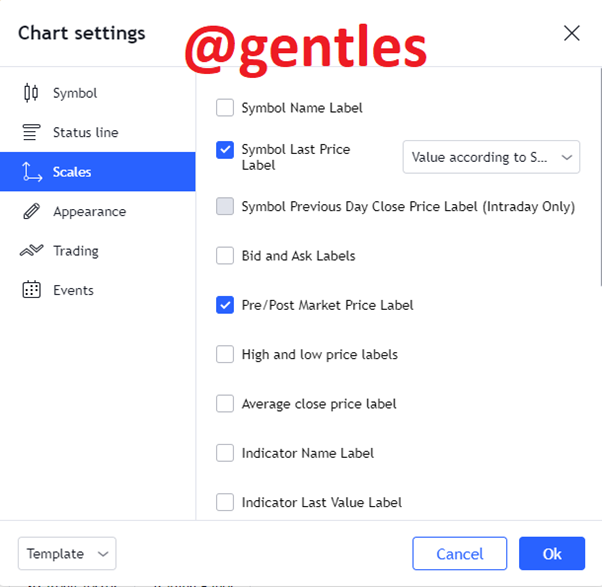
• The scales option is used to set the details of price data that are displayed on the right side of the chart.
• The appearance setting is used to manage the background appearance and other visual aspects of the chart
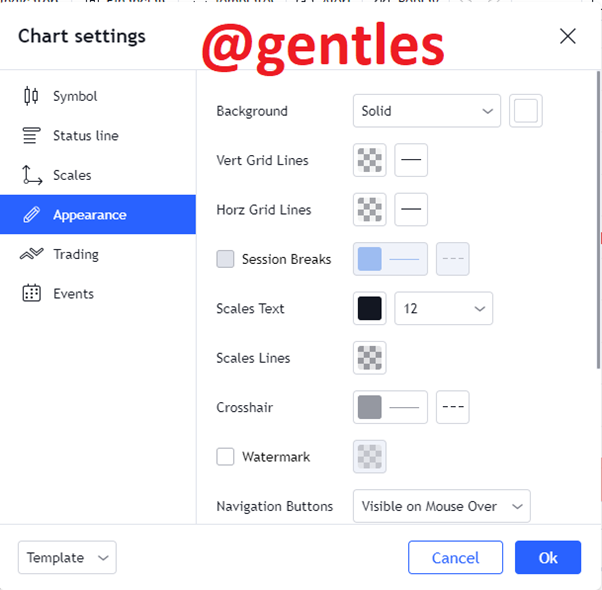
I changed the background color of the chart to this light purple color from the appearance settings.
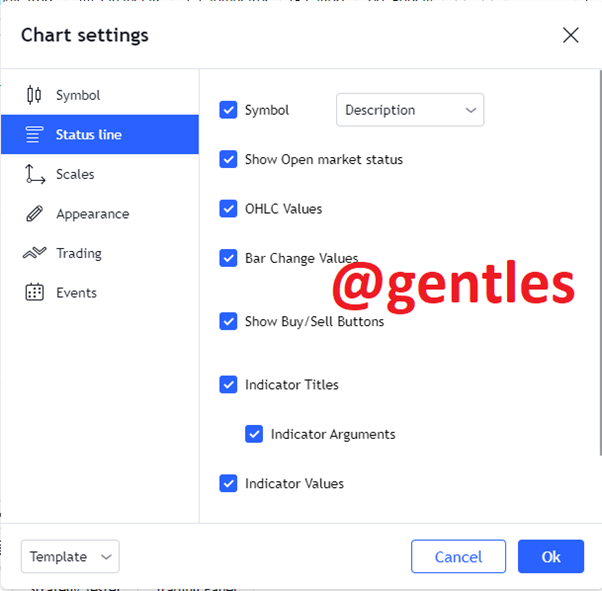
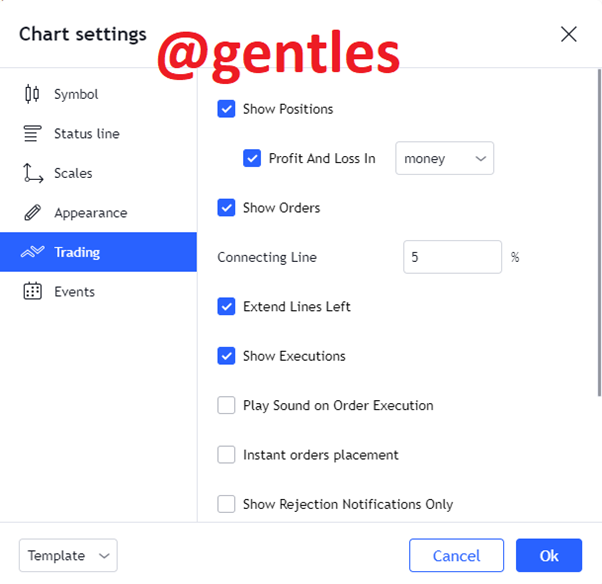
The Trading section is used to manage how assets are traded when an account is opened with a broker, it has settings like show positions, show executions, whether to play sounds when orders are executed, and so on.
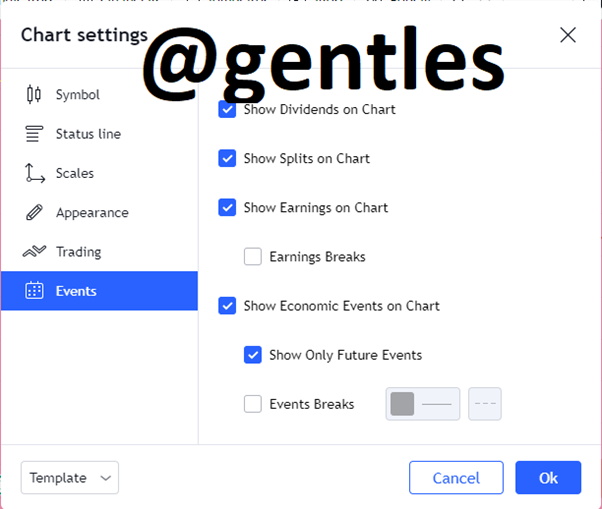
Finally, the event tab enables users to decide whether to show or hide their dividends, earnings, splits, economic events, etc.
** Use two tools to edit it.**
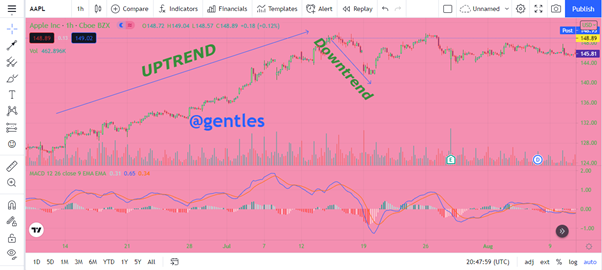
I showed an uptrend with a trend line and also used the indicator tool to show the MACD technical indicator. I also used the callout option in the annotation tool to show the MACD indicator.
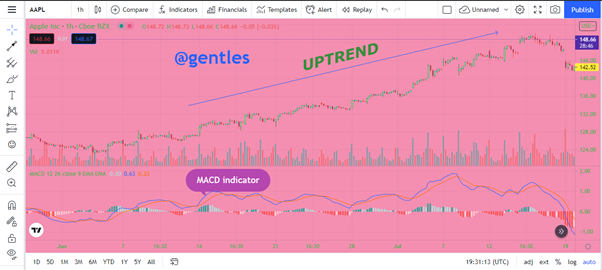
It should be noted that the free version only allows the use of three indicators at a time.
My favorite indicator is the MACD indicator. MACD is a technical momentum indicator that is used in the technical analysis of assets to look for market trends based on the price of a digital asset.
MACD displays the strength, movement, momentum, and period of a trend in the price movement of the asset. This is done by analyzing the momentum in the price of the asset using previous data to show the movement of a trend and produces signals after the analysis.
I use this indicator to see the market trend of my assets, then I decide whether to sell or buy them. For instance, if after a cross of the MACD line above the signal line and the MACD line diverges away from the signal line. It indicates an uptrend. This gives me a strong by signal
And when the MACD line converges to the signal line it indicates a downwards trend. This tells me a strong sell signal. This is why it is my favorite indicator.
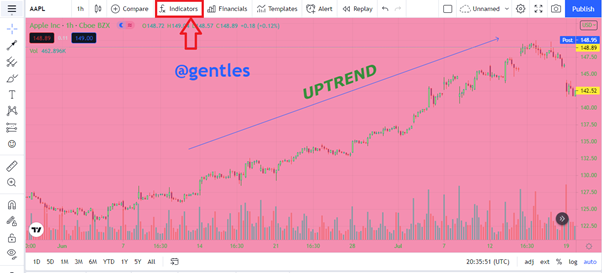
Here is how to add the MACD indicator to a chart,
First click on the fx option from the menu
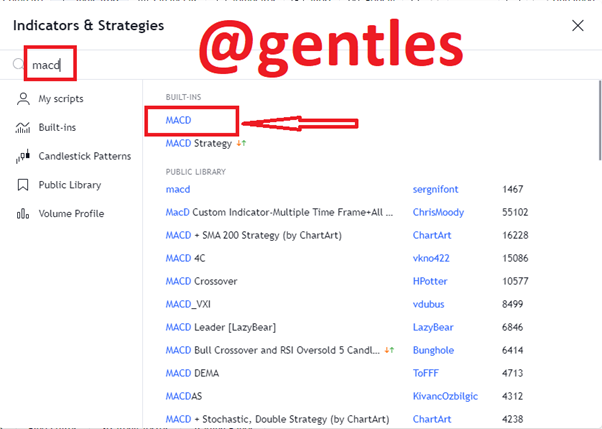
Search for MACD in the search box and click on MACD from the results and it will be displayed on the chart immediately
The MACD indicating the uptrends and downtrends can be seen below.
Yes, I think the Tradingview platform is a very vital and useful trading analysis platform to determine the cryptocurrency market price trend.
The platform has different trading tools and features like indicators and trendlines which when displayed on the charts they may indicate the market trend of an asset. Just as explained before, the MACD indicator, for example, can show the trend of a market price of an asset.
There are other features and indicators like relative strength index, golden cross, and death cross when coupled with the experience and skills of a trader that can assist in predicting the market.
Tradingview platform is a very effective and useful trading analysis site that has a variety of tools and features to aid a trader in the technical analysis of an asset.
The platform has a very friendly user interface with a lot of trading tools that make it easier to use. It also provides users with real-time data for almost every asset, be it stocks, cryptos, futures, forex, etc for a better experience.
These tools and features can only be useful if coupled with the experience and skill of a trader, so users should try and learn how to use them for good trading or brokering experience.
All screenshots, unless otherwise stated, were taken from the TradingView platform
Hi
Thanks for participating in the Steemit Crypto Academy
Feedback
This is good content. Well done with your practical study on Tradingview.