Steemit Crypto Academy | Season 3 Week 8 - Homework Post for Prof.@asaj | Crypto Assets and the Random Index (KDJ)
I never knew about the KDJ indicator, but thanks to professor @asaj I have learned about it now.
What is the Random Index
The Random Index also known as the Stochastic Index or the KDJ Indicator is a technical analysis indicator that can be used to calculate and forecast the changes in market price over a particular time period. It determines the similarities between market low price, high price, and closing price. It was developed by George Lane.
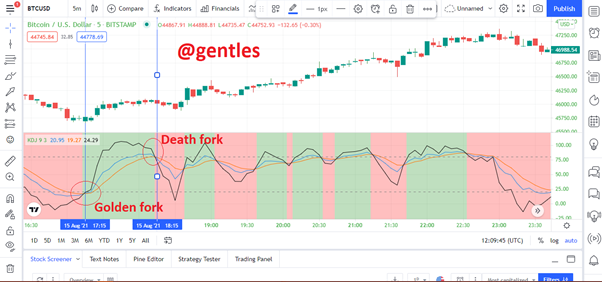
The Random Index comprises of three lines, the K, D, and J lines, hence the name KDJ Indicator. All these three lines come together to construct the independent curves and also help in forecasting the trend of the golden price. The K and D lines help in determining the changes in the behavior of buying and selling. The J line on the other hand illustrates the divergence of the D value and the K value. Among the lines, J is the fastest due to its high sensitivity and it is followed by the K line, the D line is slowest and also has the lowest sensitivity. The Random Indicator is very similar to the Stochastic oscillator but they differ with the presence of the J line in the Random Indicator.
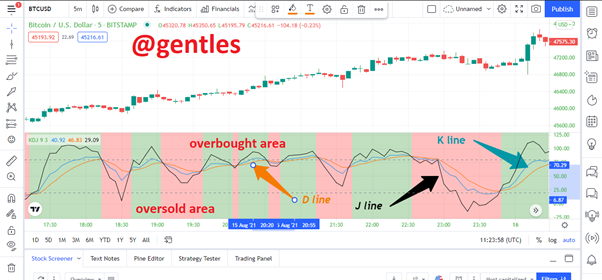
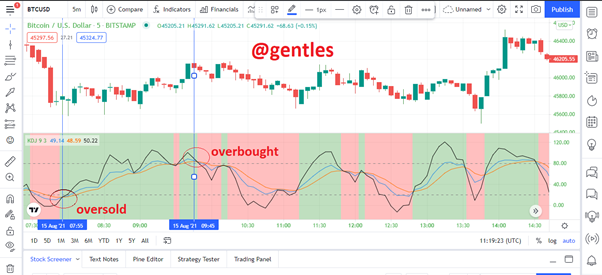
The Random index ranges between 0 and 100 on the price chart and it is divided into three sections, they are; above 80, below 20, and between 20 and 80. When the price is above 80 it indicates an overbought position and when it is below 20 it depicts an oversold position. It is said to be balanced when it is between 20 and 80.
Aside from this, the KDJ lines can forecast the market in another way. If the K, D, and J values are above 50, it depicts a long market and the market is expected to be bullish in the future and if the KDJ values are below 50 it foretells a short market.
If the J value is above the K value and K is also above the D value, the three curves align in a long position which shows the market is a long market and it gives a buy signal.
All these help to determine the market price behavior and best market entry points.
How to calculate the Random Index
In the calculation of the KDJ indicator, the lowest, highest, and closing prices of a certain time period are needed. The day is represented with n. The prices will be as follows
But first, we will need to calculate the immature random index value also known as the RSV of the period. It ranges between 1 and 100. The formula is as follows.
We then proceed to calculate the K, J, and the D values using the following formulas;
50 can be used as the K and D values of the previous day in case there is none.
Beginning at the week level, short-term and medium-term prices can be determined using the Random indicator.
Is the random index reliable? Explain
As we all may know, the random index is a technical indicator that can be used to determine the trend of a market. Just like other indicators and technical analysis tools, the random index also had its shortfalls which means it is not 100% perfect and also not completely reliable. It can give false signals. However, when it is coupled with the trader’s experience, skills other indicators like ATR, MACD, RSI, or ADX, it can be a powerful tool and make it more reliable.
It is advisable to gain some experience in other indicators, tools, and strategies and it will help traders to appreciate the KDJ indicator.
How to add the Random Index to a chart
For the sake of this assignment, I will be using the TradingView analysis platform.
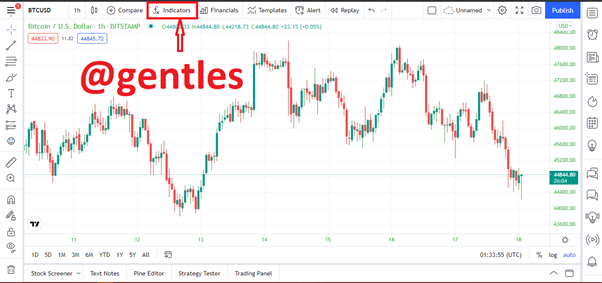
First, go to their website of trading view and click on Chart.

The chart window will open. BTCUSD is the cryptocurrency pair I am using.
Click on fx Indicators and the indicators section will open.
In the search box, enter KDJ and select the KDJ By ll21LAMBOS21 from the list. It is known to be more reliable.
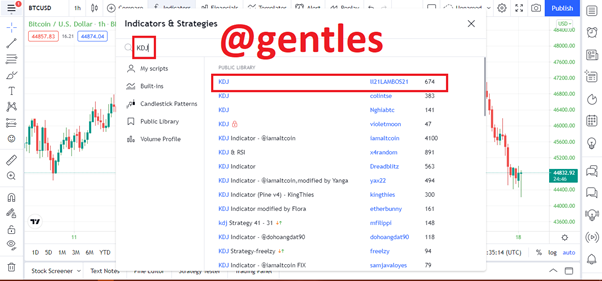
As soon as it is selected, the indicator will be loaded right below the chart.
The recommended Parameters
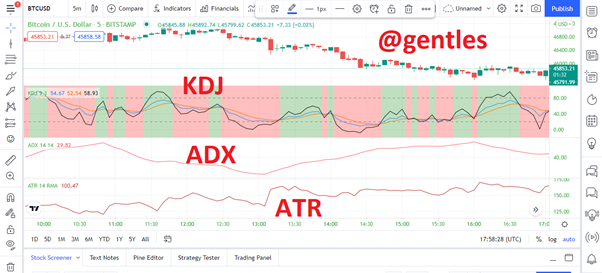
Differences between KDJ, ADX and ATR
The KDJ indicator
It aids in detecting whether the asset is overbought or oversold by analyzing the price trend. When the K line goes above or close to 80, it depicts an overbought signal which is followed by a downtrend. When it goes below or near 20, it gives an oversold signal which is followed by an uptrend. It works best when combined with other indicators. It was developed by George Lane.
The ADX indicator
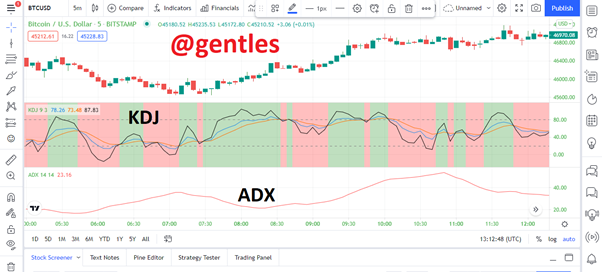
ADX is the shortened form of the Average Directional Index. It was invented by J. Welles Wilder and it helps in determining the strength of an asset’s price trend. The price range expansion over the time period gives the ADX value. Unlike the KDJ indicator, it has only a single line that moves within the range of 0 and 100. Traders and investors use it to find price trends strong enough to trade.
The table shows the ADX value and its corresponding strength
| ADX value | Strength of Trend |
|---|---|
| 0-25 | Weak |
| 25-50 | Strong |
| 50-75 | Very strong |
| 75-100 | Extreme strong |
The ATR Indicator
ATR indicator is the short form of Average True Range. It is used to check the volatility of the price of an asset at a certain time. It moves as the price of the asset move. The gaps between price movement are used to calculate it. It is also a single line, unlike the KDJ. It was invented by J Welles Wilder.
Summary of their differences.
| KDJ | ADX | ATR |
|---|---|---|
| It determines the trend of the market | it measures the strength of the trend | it gives the volatility of the asset |
| It shows the direction of the price | it doesn’t show the direction of the price | it also doesn’t show the direction of the asset |
| It consists of three lines; K, D, and J lines | it has one line by default but it DI+ and DI- lines can be added | it has only one line |
| For solid decisions, it should be coupled with ADX or ATR | it should be combined with DM moving average to give the trend of the market | it should be used together with moving average indicator |
Use the signals of the random index to buy and sell any two cryptocurrencies. (Screenshot required)
Sell
I first made a sell order of the TRX/BTC pair. The KDJ indicator gave a sell signal at exactly 15:10 on 18 August when the lines crossed above 80 which also meant the asset was overbought.
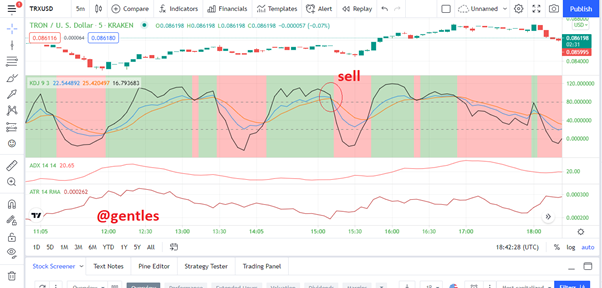
I expected a downtrend to follow immediately so I placed a sell order on Binance. The price of the asset at the time was 0.084870USD.
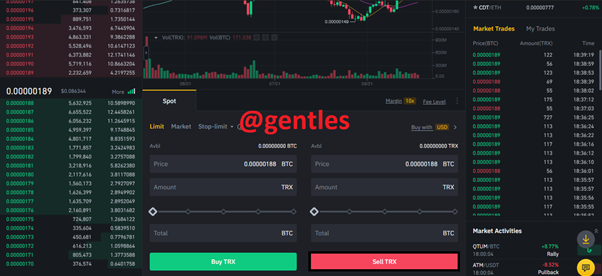
After the fall in price which was at 15:25, it landed at 0.084571USD. the indicator saved from losing about 0.000299USD.
Buy
For the second cryptocurrency, I chose the STEEM/BTC market. At exactly 13:00 on 18 August, the K line crossed the D line from below and showed a buy signal.
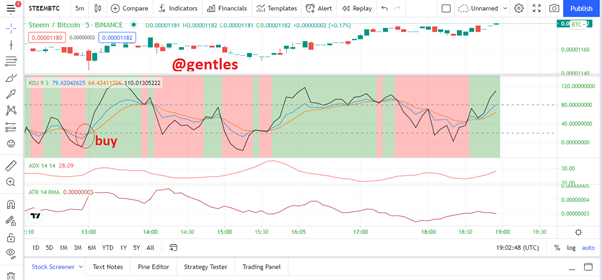
So, I placed a sell order and it was priced at 0.00001154BTC.
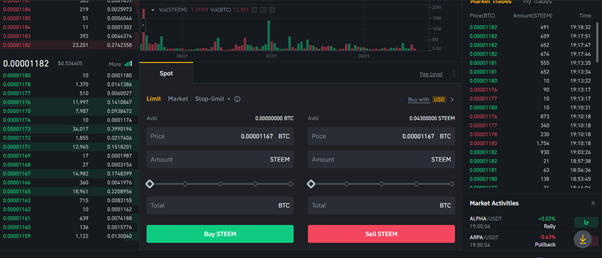
The price rose as expected and it landed at 0.00001165BTC. This means I gained a profit of 0.000011BTC.
Conclusion
The KDJ indicator or the Random index is used to determine the trend of the price of an asset at a certain time period. Just like other indicators, it is not perfect. However, it can be a very powerful tool when coupled with other indicators and the experience of the trader. So, it is recommended to combine it with other Indicators like the ADX and ATR indicators to make trade decisions like buying and selling.
Good job @gentles!
Thanks for performing the above task in the eighth week of Steemit Crypto Academy Season 3. The time and effort put into this work is appreciated. Hence, you have scored 6.5 out of 10. Here are the details:
Remarks
Though you did not provide new information, you have displayed a good understanding of the topic. You have performed the assigned task excellently. However, you did not provide the configuration parameters of KDJ indicator in task 3.
That said, this is good work. Thanks again for your contributing your time and effort to the academy.