Steemit Crypto Academy Season 5, Week 5|Advanced Course|Homework Post for @sapwood, Onchain Metrics (Part 3)
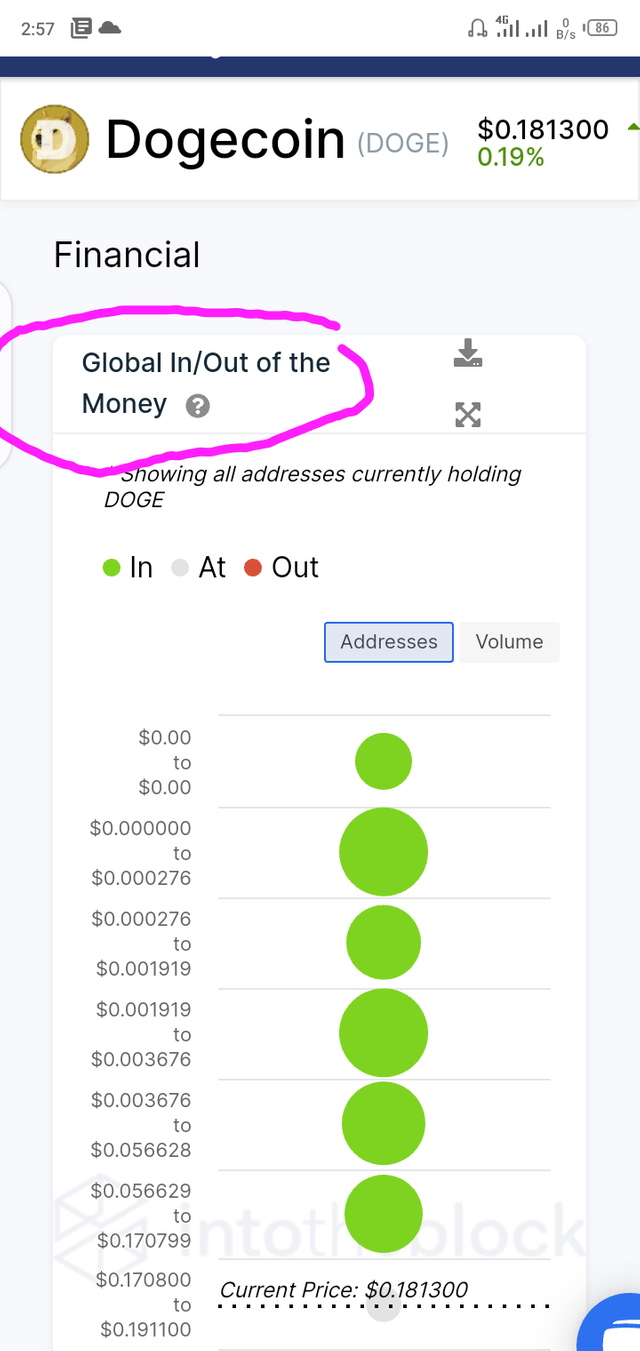
GLOBAL IN/OUT OF THE MONEY
We can discover which coin is Buying/Selling the most in each time frame on that Exchange by utilizing certain indicators that will ease our work.
But we don't think about which coin traders are exhibiting the most interest globally, how much money they're investing and what price they're buying, or what insider information they have that we can't possible know in real life.
Global In/Out of the Money (GIOM) is an on-chain data method in which a large number of prices are recorded for a particular asset, as well as where that asset was bought and held at the time, along with their addresses. As these events occur over time, they form a cluster that is used to make that price range easier to understand. The GIOM is used to determine whether an asset's address is profitable or not.
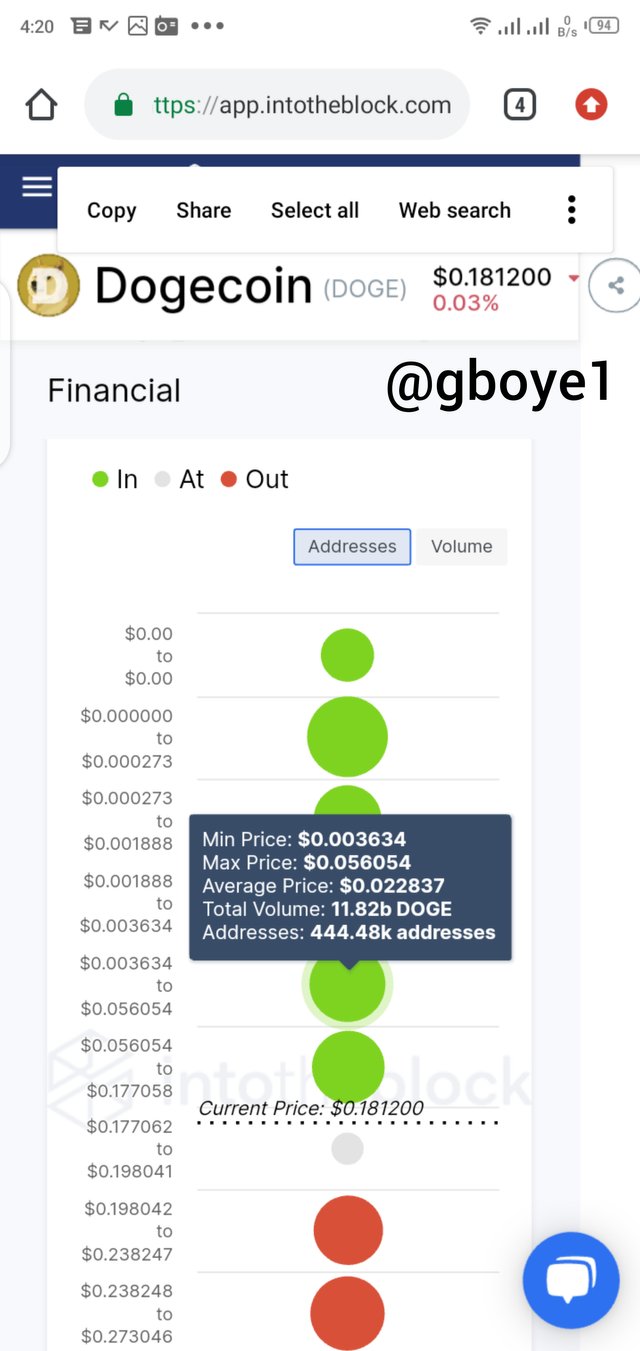
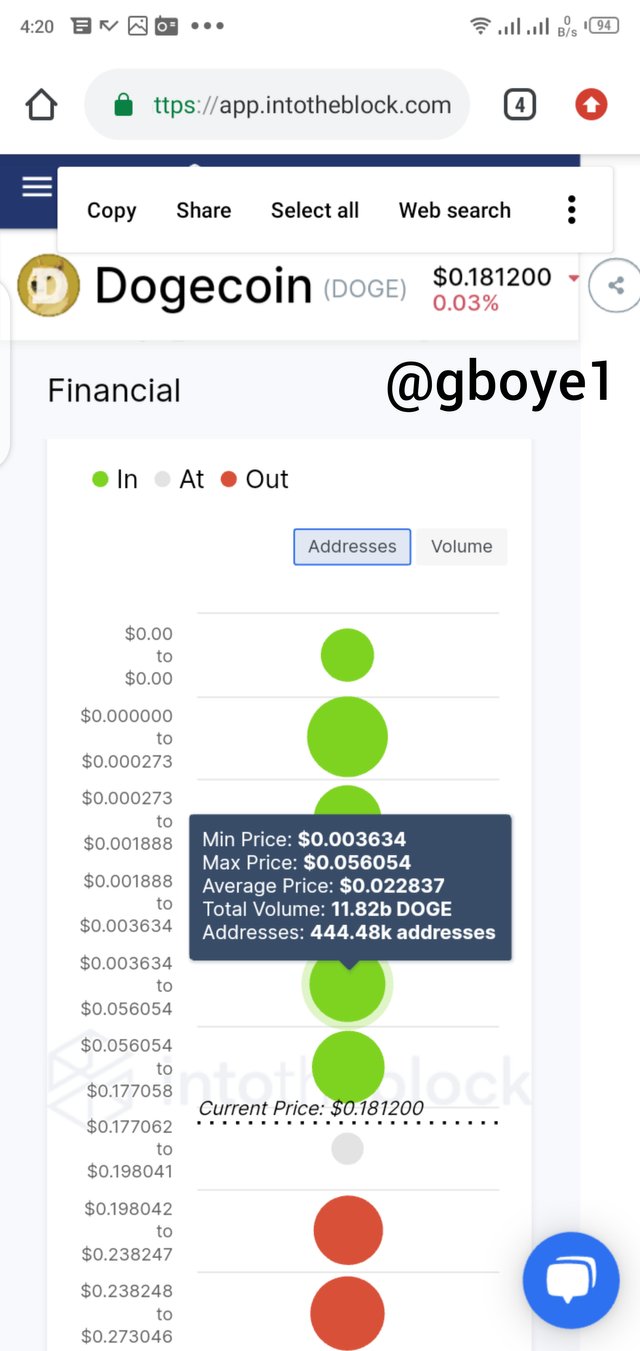
Holder addresses are classified by GIOM based on their gains/losses in relation to the current price in a circle. Cluster is the name given to the circles. GIOM displays its signal in a variety of clusters. Price range, average price, total number of addresses, and total volume are all included in each cluster.
According to my market cluster, 444.48k address holders purchased Dogecoin at an average price of $0.022837, with an 11.82 billion Doge volume ranging from $0.003634 to $0.056054.
It not only displays information about the holders, but it also displays Doge support and resistance levels in light of current market conditions.
The size of the cluster is determined by the total volume of that price range.
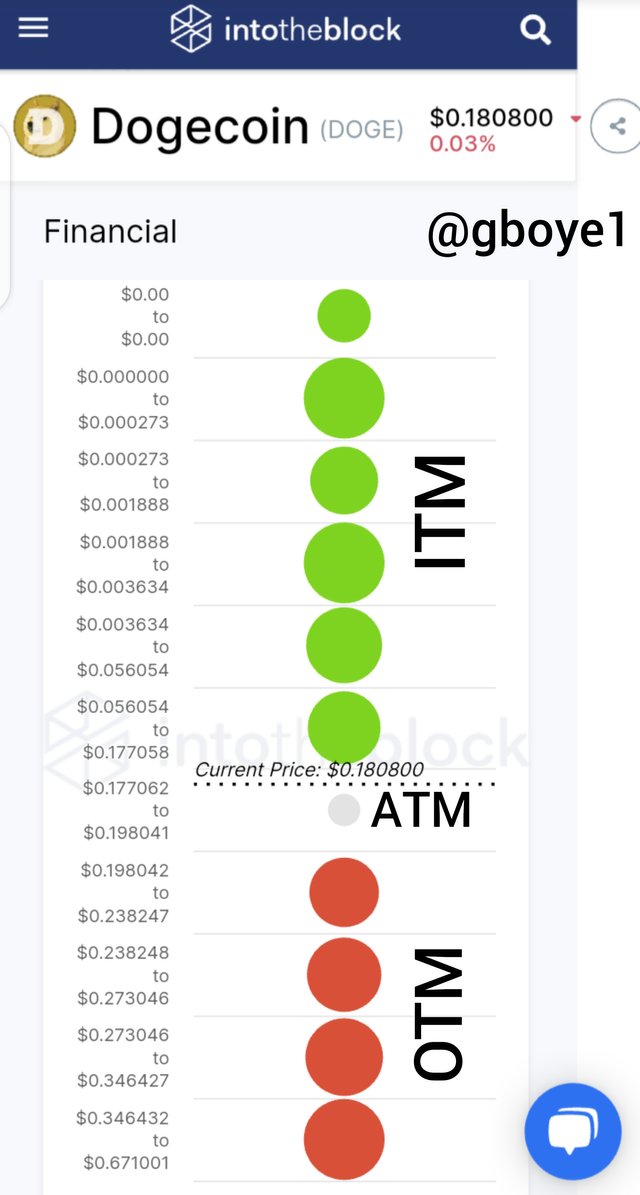
There are three points we noted in the image above, which below;
- IN THE MONEY
- AT THE MONEY
- OUT OF THE MONEY
IN THE MONEY
We already know that GIOM shows the positions of investors in a crypto asset in an array of clusters related to the current price.
If the current price of an asset exceeds the higher range of a cluster, that cluster is said to be In The Money (ITM). We receive more support in that pricing range if we increase the size.
AT THE MONEY
When the current price of an item is equal to or falls within the range of the cluster, it is considered to be At the Money (ATM).
OUT OF THE MONEY
In this Situation, if the current price of the asset is lesser than the range of the cluster then it can be said to Out of the Money (ATM).
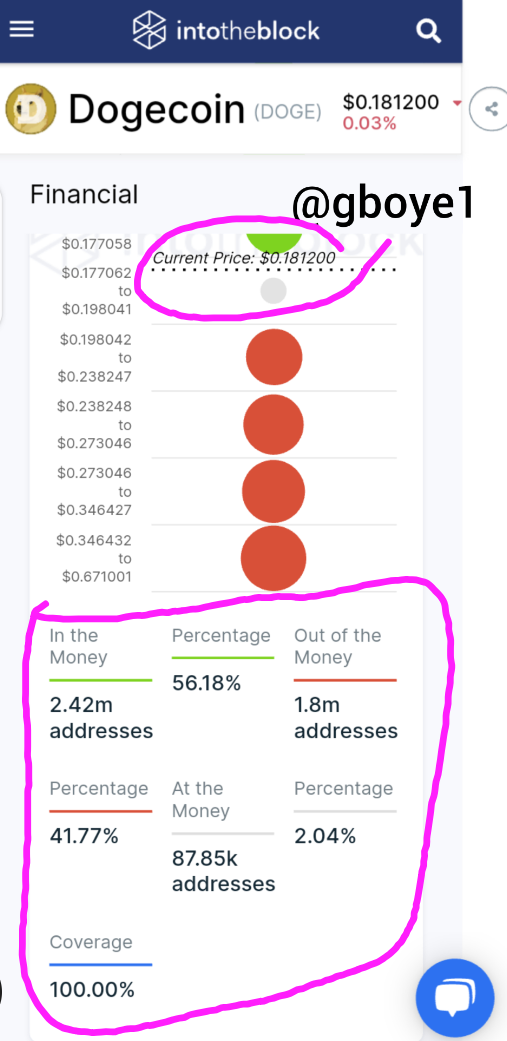
The current price of DOGE is $0.181200
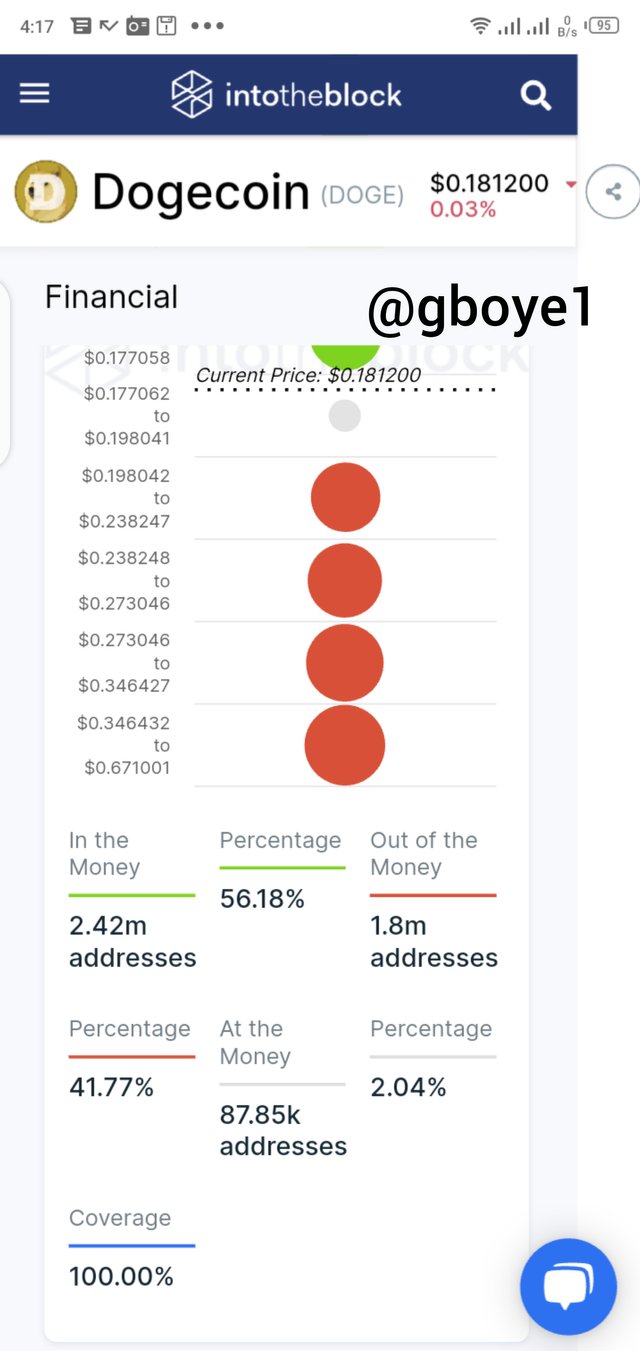
According to data, 2.42 million addresse are currently In The Money, 1.8 million addresses are Out Of The Money, and 87.85 thousand addresses are At The Money.
That is the distinction between ITM and OTM significant market trends. We can receive insights about Buying/Selling pressure in the market using the Global In/Out of the Money tool, and we can also discover Resistance and Support levels by analyzing clusters.
LARGE TRANSACTION VOLUME INDICATOR
Every transaction with a value larger than $100k is checked by the large Transaction Volume indicator. The large transaction volume suggests that a whale has entered the market, or that a major financial institution, such as banks or others, has entered the market.
The large transaction generally gathers all transactions worth more than $100k and plots a graph as total or adjusted. Typically, whales or large financial organizations purchase or sell in the market.
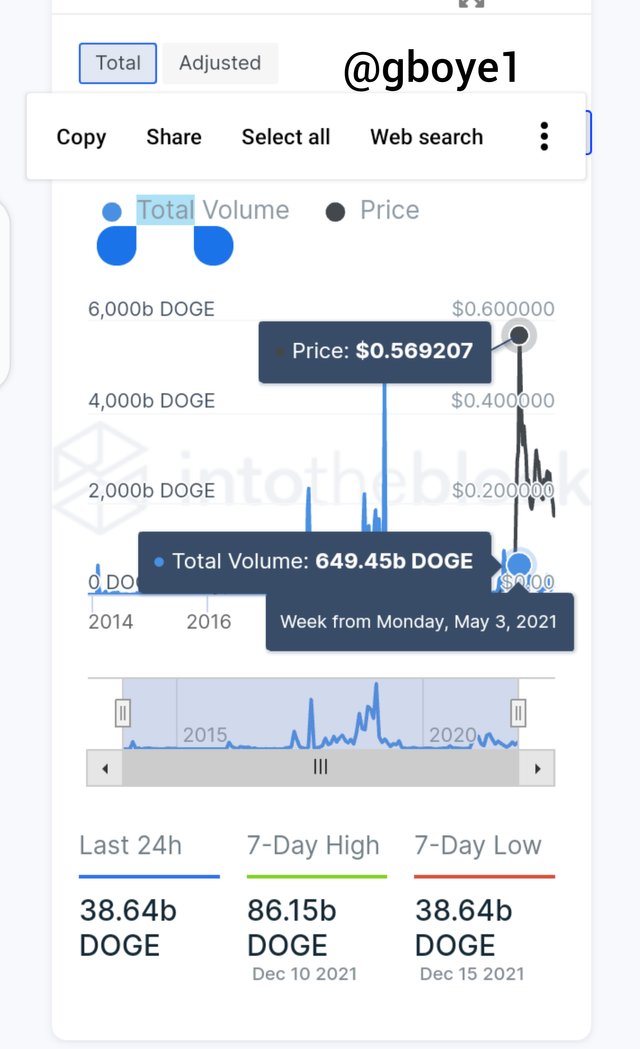
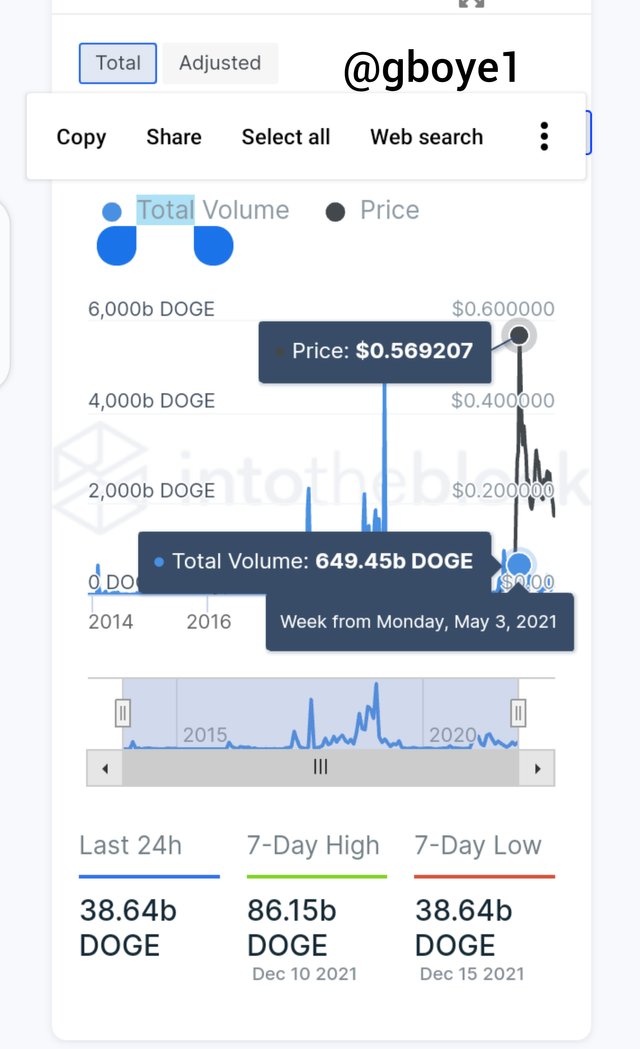
Most of the time, the Total large transaction generates deceptive results, such as when one address does more than two transactions, which the Total large transaction will only record. However, the transaction is checked and verified one at a time by the Adjusted transaction filter.
The spike is 649.46 billion Doge at a $0.569207 level, as shown in the image below.
ADJUSTED LARGE TRANSACTION VOLUME
The Large Transaction Volume indicator, as we all know, displays information on all transaction activity with a volume of more than $100000.
Nevertheless, users may transfer volume from one account to another before returning to the original account.
Then send first, then it gets back. This activity is recorded twice by the Large Transactions Indicator in this case. However, because he transmits and receives, it must be a single transaction; if we record it twice, we will receive incorrect information; if we make our entry based on this, we may lose our investment.
So, by using Adjusted metrics, we can eliminate the chart's repeated transaction data, allowing us to obtain accurate transaction details.
ANALYSIS
The current total volume of Dogecoin is 11.82 billion DOGE, with 444.48 thousand addresses. There is now a maximum price of $0.056054 and a minimum price of $0.003634 with an average price of $0.022837. Which makes up the cluster?
From the image above, the following are information's on the In the Money, the At the money and the Out of the money.
ITM: The cluster generates 2.42 million Dogecoin addresses, with a percentage of 58.18 percent.
ATM: 87.85 thousand addresses are generated by the cluster, with a percentage of 2.04 percent.
OTM: The cluster generates 1.8 million Dogecoin addresses with a percentage of 41.77 percent.
The most recent major rise occurred on Monday 3rd may , 2021, when up to 649.45 billion Doge were generated at a price of $0.569207, indicating that the ETC market is bullish.
GLOBAL IN/OUT OF MONEY MOMENTUM
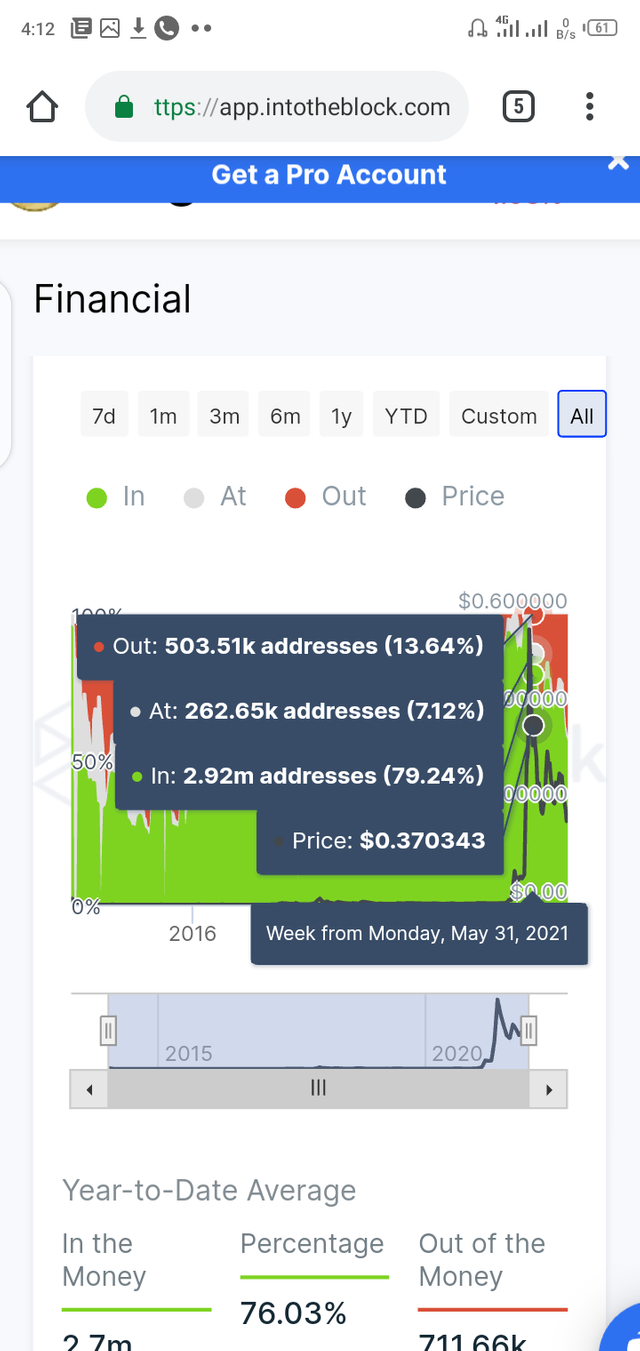
On checking On-Chain data, on 31st may, 2021
At that Time the price was = $0.370343
ITM = 2.92 million Addresses (79.25%)
OTM = 503.51k Addresses(13.64%)
ATM = 262.65K Addresses(7.12%)
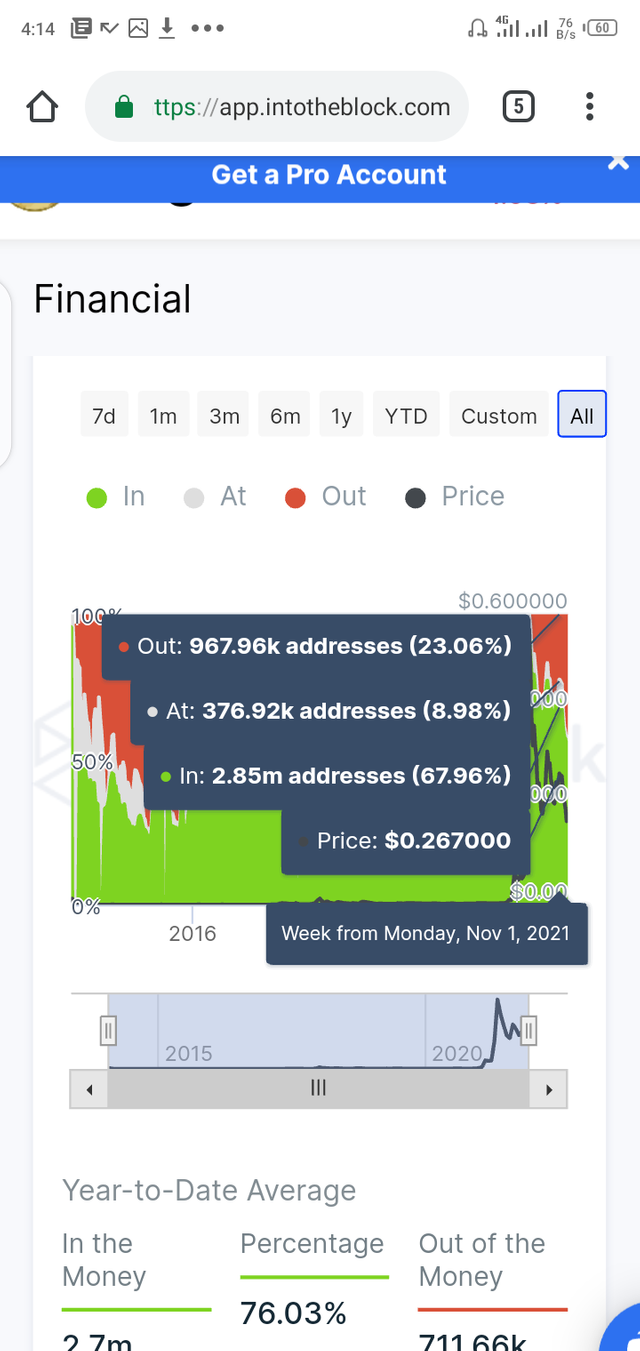
Then after it starts dropping drastically from 31st may to 1st November 2021.
On 1st November 2021 we were having
Price = $0.267000
ITM =2.85 million Addresses ( 67.96%)
OTM = 967.96 K Addresses (23.06%)
ATM = 376.92K Addresses (8.98%)
When you compare the 31st of may to the 1st of November, you'll notice that Doge is steadily decreasing. It indicates a downward trend.
CONCLUSION
The GIOM represents the price-cluster relationship. Clusters are price ranges in which a huge bank or whale investor has invested and held for a few days.
There are numerous tools for extracting the data we require for Fundamental analysis.
