Steemit Crypto Academy Season 4, Week 3|Advanced Course|Homework Post for @sapwood, Onchain Metrics (Part 2)
WHAT IS REALISED CAP
When we talk of the realized cap we are referring to the sum of the result of adding together the amount of all the native units that an asset possesses based on the closing price as at the when (the day) the last movement of the native unit was experienced.
This helps to minimize the impact of loss and also long coins that are inactive, for instance if the last moved coin at a price that is cheap is spent, it will enhance the value of the coin to be at the same level with the current price and this in turn gives an increase to the realized cap by an equivalent amount.
This also is the case when you spend a coin at a lower price compared to its last movement, the value of the coin will become cheaper and thus there will be an equivalent decrease on the realized cap.
HOW IS THE REALISED CAP CALCULATED?
The calculation of the realized cap goes thus.
REALISED CAP = ∑ OF EACH UTXO x THE PRICE AT CREATION
THE MARKET CAP
The market capitalization can be referred to as the entirety of the value of a cryptocurrency, the value of the market cap is derived by the multiplication of the crypto price by the number of coins that is in circulation. It is one of the ways to evaluate or ascertain the worth of a company.
The use of the market cap is most times to refer to the worth of a company and the value is mirrored in the risk rate of investing in that company. If a trader or an investor has interest in knowing the potential or the scope of a crypto token then the knowledge of the crypto market cap will be of great use, nevertheless it is not a key factor to determine your decisions on investment.
MARKET CAP = THE TOTAL SUPPLY x THE USD PRICE
PRACTICAL EXAMPLES TO CALCULATING THE REALISED CAP AND THE MARKET CAP
The following is an example of how to compute the Realized Cap.
Assume BTC has a total of 12 UTXOs and a 12 LTC circulating supply.6 LTC has not moved since 2017 (the price of BTC was $12 the last time it was transacted), 4 BTC has not moved since 2019 (the last time it was transacted, the price of LTC was $4), 3 BTC has not moved since 2020 (the last time it was transacted, the price of BTC was $150), and 2 LTC has not moved since 2021 (the last time it was transacted, the price of LTC was $75). The Realized Cap will be determined by the following formula:
Realised cap = (6 x 12) + (4 x 4) + (3 x 150) + (2 x 75) =$ 688
Using the same assumption, the current LTC price of $165.85 may be used to compute the market cap of LTC.
Market Cap = 25 x 165.85
Market cap = $4,146.25
MAJOR DISSIMILARITIES BETWEEN REALISED CAP AND MARKET CAP
The table below shows the differences between the realized capitalization and the market capitalization:
| REALISED CAP | MARKET CAP |
|---|---|
| It is not so easy to calculate | Its calculation is quite easy |
| It is influenced by trading | There is no link between the number of trades and the amount of money earned. |
| More stable | Quite unstable |
For crypto-assets with a UTXO record, this can be determined|Any asset posted in the market can be calculated.
ANALYSIS USING SANTIMENT WEBSITE
We will be creating a fundamental analysis for BTC using a short term model and a long term model
REALISED CAP (ANALYSIS)
In a bullish or uptrending market, realized cap rises, in a flat market, realized cap remains flat, and in a bearish market, realized cap decreases at a slower rate than market price.
THE SHORT TERM (3 MONTHS) ANALYSIS
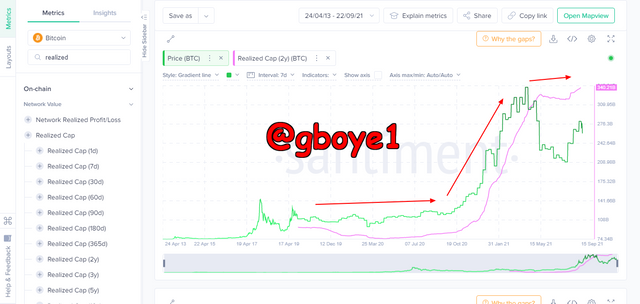
From the above chart BTC was trading in a range, while the Realized cap was moving in a lateral direction. The price began to rise on October 20, 2020, and continued to do so until April, 2021, with higher highs and lower lows.
The price increased from $35,350.15 to $52,651.51 over this time, while the realized cap increased from $256.35 billion to $287.39 billion. The price declined to $41,629.44 after peaking at 48k in April, 2021, but the realized cap grew slightly to $377.33B, indicating that the drop in price had no effect on the realized cap.
THE LONG TERM (1 YEAR +) ANALYSIS
Looking at the above image we see that a lateral movement of the realized cap followed a ranging price. An uptrend spike also indicates that the realized cap has moved in the same direction as the trend.
The price dropped from $58,232 to $31,533 between March 2021 and May, 2021, while the realized cap remained same, moving from $349.72 billion to $349.46 billion.
When the price is in a positive trend, the realized cap has a strong association with price, but when the price is in a downturn, the realized cap tends to go lateral or sideways. The long-term and short-term charts are the same.
THE MARKET CAP (ANALYSIS)
The total number of coins in circulation multiplied by the current market price equals the market cap. Because the supply of BTC is so limited in comparison to the price, only price changes have a significant impact.
Because there is no option to analyze short and long term on santiment.net, we will look at the market cap change in relation to the price here.
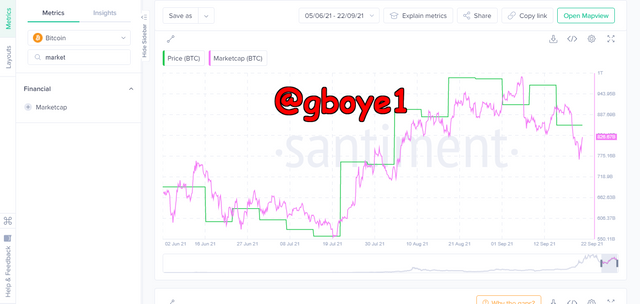
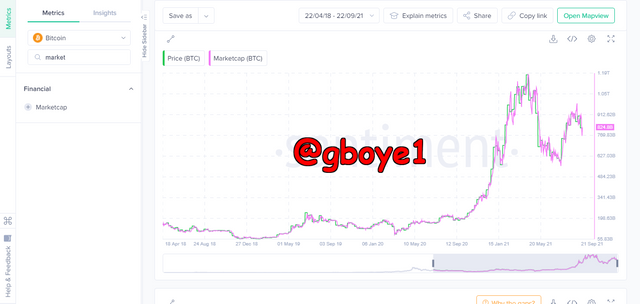
Even on the short and long term charts, the market cap exhibited a perfect association with price movement on the Market cap Price analysis chart.
THE SHORT TERM (3 MONTHS) ANALYSIS
The market cap and price movement in the direction are depicted in the chart analysis. This is due to the fact that the price is determined by the market capitalization. In the chart above the price fell to 29,000 on July 10, 2021, with a market value of 556 billion.
The price began to rise and peaked at 52,000 on September 9, 2021, with a market capitalization of 991 billion.
THE LONG TERM (1 YEAR +) ANALYSIS
The correlation of price trend and market cap did not differ in the long term chart. The price was $4,324 on February 5th, 2020, and the market value was $64 billion. The price rose in an uptrend and peaked at $63k on April 14, 2021, with a market cap of $1.18T Price and market capitalization both went in the same direction and had a perfect connection.
THE MVRV RATIO (ANALYSIS)
The MVRV ratio is an on-chain statistic that is calculated by dividing the market capitalization by the realized capitalization. It's used to figure out if a price is above or below fair value.
The MVRV ratio helps forecast bullish and bearish movements. If the MVRV is more than one and the highs and lows are higher, the upward trend is expected to continue. A negative trend will be continued if MVRV is less than 100% (below 1) and lower highs and lower bottoms occur.
THE SHORT TERM (3 MONTHS) ANALYSIS
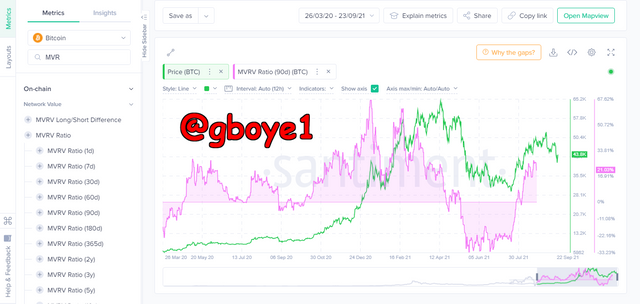
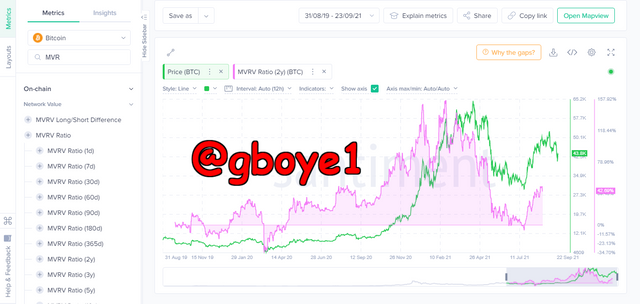
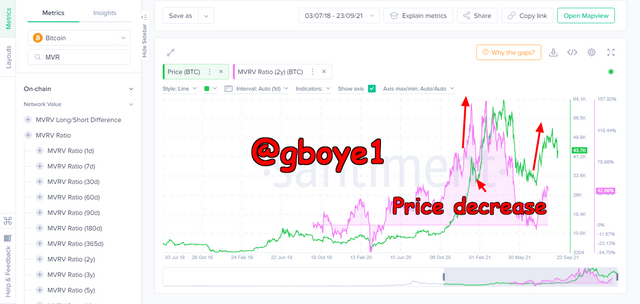
Even at its all-time high of $65.2k, the MVRV ratio on the short-term analysis chart does not exceed 67.62 per cent. As a result, it fails to persuade. The chart is also noisy, with an MVRV ratio of less than 0 on many occasions in a downtrending market.
THE LONG TERM (1 YEAR +) ANALYSIS
Long-term charts are less noisy than short-term charts. In both long and short term market research, the MVRV ratio demonstrated a strong price association with its movement.
IS THE MVRV RATIO BENEFICIAL IN PREDICTING A TREND AND TAKE POSITION?
MVRV is an on-chain indicator that may be used to determine if a market is overpriced or undervalued. One thing to keep in mind while conducting research is that long-term analysis produces significantly better results than short-term analysis.
On the graph, it is expressed as a percentage. A correction can occur if the market is in an upward trend and the MVRV ratio is greater, but after the correction is done, the market might restart its upward trend. If MVRV is less than 100 percent in a bull market, it might be a bottom out indicator, and a buy position should be opened near this level.
HOW RELIABLE IS THE UPPER THRESHOLD AND THE LOWER THRESHOLD
When the MVRV ratio reaches the upper threshold level, there is usually no big sell-off and only a minor price decrease. Because every time the MVRV ratio reaches the lower barrier, it is always followed by a positive price action, the lower threshold is more dependable.
It's also clear from the chart that beyond the upper barrier, selling pressure doesn't start right away and can even go higher, making it harder to anticipate the peak. However, below the lower threshold, it's easier to predict the bottom because it doesn't fall much lower.
WHAT ARE THE CONDITIONS FOR A STEEP DOWNTREND IN THE REALISED CAP
Only a large fraction of the UTXO that have not been spent will be spent at a lower price than their last transacted price, resulting in a sharp fall in the Realized cap.
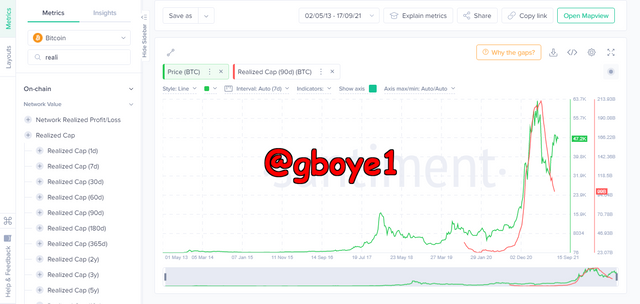
In fact, this never happens since UTXO hodlers' mentality is to hodl the coins when the price is low and sell when the price is high. The All-Time BTC Realized Cap Chart shown below shows that there has never been a significant decline.
If most traders/investors started selling their holdings in a panic situation, Realized cap may fall into a strong decline in a negative trend. UTXO movement will rise in this situation. With rising UTXO movement and lowering prices, the price of a new UTXO product and its development will also reduce. A severe decline in the realized cap may be seen in this situation.
CONCLUSION
On-chain metrics are components of price fluctuation that are created by on-chain network operations. On-chain measurements are frequently linked to price changes and currency circulation.
Detail research is necessary before investing in a long-term forecast, and the realized cap, market cap, and MVRV ratio on-chain indicators add to this.
With formation peaks and lows, the MVRV ratio aggregates a coin's average price over a certain time, which typically correlates to price movement but also indicates to a probable reversal ahead of price.
Thank you for reading my post

