Steemit Crypto Academy Season 2: Week6 |Homework Post for Professor @fendit, Elliott Wave Theory
ELLIOT WAVE THEORY (EWT)
Elliot wave theory is another technical analysis tool that was founded by Nelson Elliot Rapheal, the acronym been EWT. It was discovered by Elliot in the 1930s after he retired from work, he didn't want to become idle so he started studying charts for serveral years. During his study he came across the trend which all charts has. His discovery became quite popular in 1935 when he made a forecast that was legit and this brought the interest of traders and investors. He published a book in reference to his discovery titled THE WAVE PRINCIPLE. His theory helps traders and investors to know the market trend or cycle and get signals on trades.
This theory is based on the human behavior, this is the mentality in which every trader or investors has built themselves which always make the theory prediction right. His theory also made analyst create an indicator that works with the same principle on trading platforms.
HOW DOES THE THEORY WORK
This theory has a pattern it follows or a trend, whenever they are identified on a chart there will be a signal. The trends are called WAVES. We have the impulsive waves and the corrective waves.
- The impulsive waves: The impulsive waves is a group of 5 waves called a subwave which move in the same trend, either in a bullish or a bearish trend. This trend is easy to notice on the chart. Not all 5 waves moving on the chart is a impulsive wave. There are guides set aside by Elliot to differentiate the waves from normal waves.
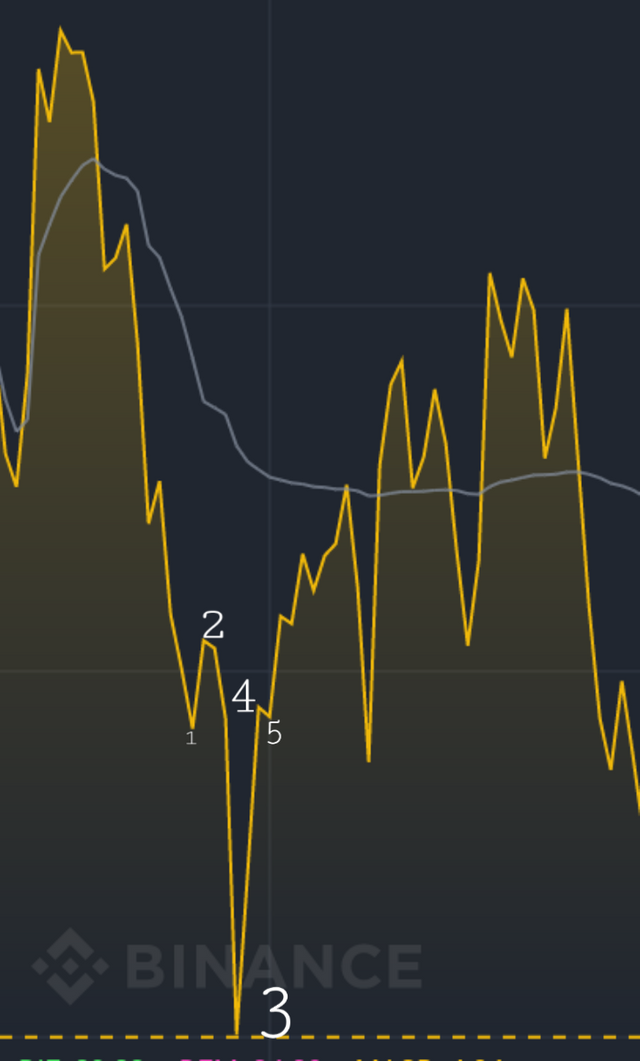
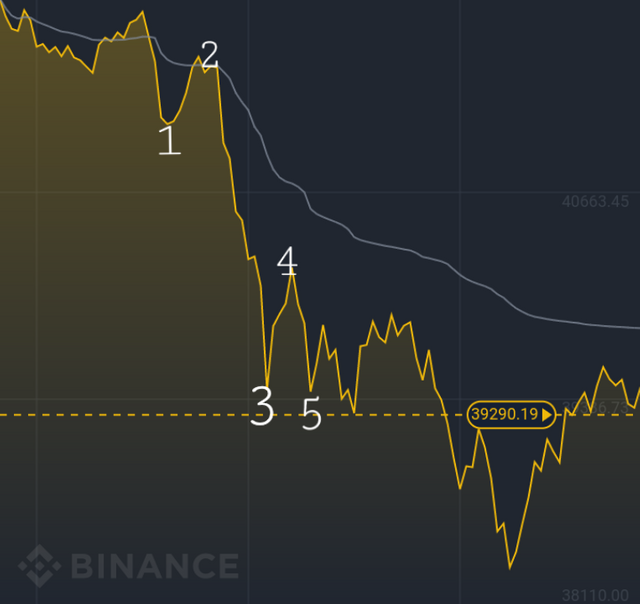
It say that on no occasion should Sub wave 2 move lower or higher than Sub wave 1. Also it is important that sb wave 3 is the longest moving wave amongst others. Lastly wave 4 shouldn't move lower than wave 3 in any case.

This is a bearish impulsive wave. For a bullish impulsive wave the trend will move upward unlike this particular chart.
Wave interpretation
Wave 1: this is caused by early investors who are taking profits, which causes a dip
Wave 2: the investors buy into the coin Again cos of the dip and there is a rise in price also.
Wave 3: alot of investors are taking profits which is causing a strong dip in the market. The investors have doubled and that's why the dip is also great.
Wave 4: fter the dip investors will buy into the market again which will cause a rise.
Wave 5: new investors will rush to take profit again and that's the end of the cycle.
Corrective wave
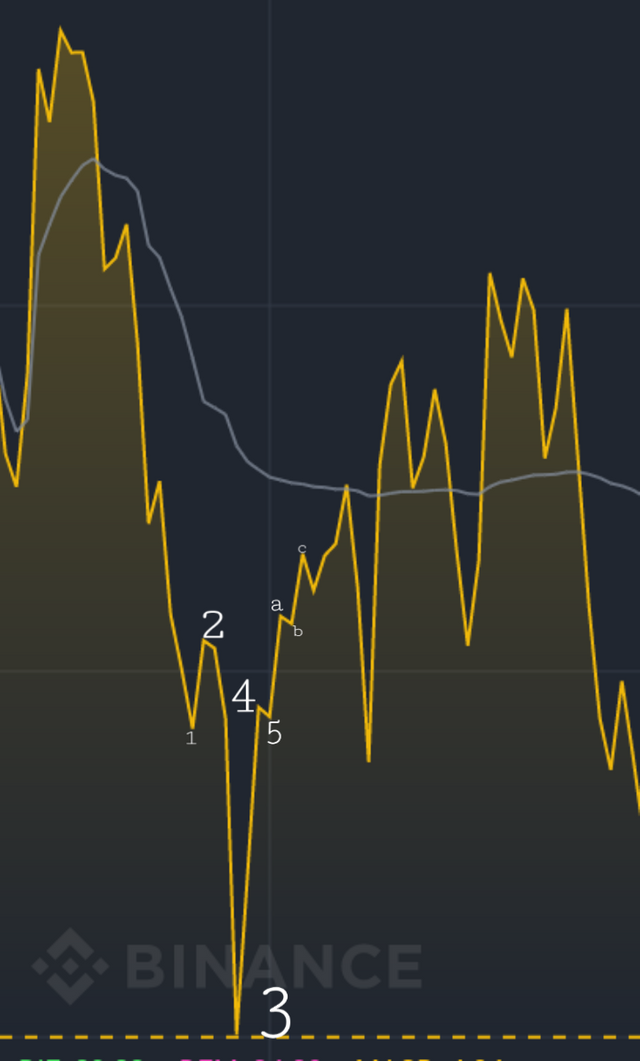
These are usually the next 3 sub waves that follows after the impulsive ways. This waves put the market back to order like the name implies. They go in complete opposite of the impulsive waves, if it doesn't go in the opposite direction then it's not a corrective wave. The chart below doesn't follow the opposite trend. It kept going in a downward trend.

The corrective waves are usually represented by the letter a.b and c. The waves can be in 3 forms.
APPLICATION OF ELLIOT WAVE THEORY
Elliot wave theory is applied in trading mainly be it Cryptocurrencies, forex or commodities. It can be applied in all. It helps to detect when a trader should opt into a market. To study the cycle and trend of the market and know when to buy or sell ones asset.
Conclusion
Elliot wave theory is a very brilliant technical analysis tool to use by traders, it is easy to use and also proffers valid signals. It can prevent traders from lot of loss. If studied properly the false signals are easy to spot. Also note that the impulsive wave and the Correctional wave are what makes up the Elliot wave theory do not trade based on just one of the waves alone it might bring wrong forecasting for the trader. Also ensure to always make use of other tools also to verify the signals gotten from EWT.
COINCHART FOR BTCUSDT

This is a chart showing the BTCUSDT pair. The screenshot is taken on 20th of May 2021 showing a downtrend then uptrend movement. The EWT is for a bearish trend which signifies that there will be increase in price after the completion of the cycle. The investors took a huge profit after the last rise in price and there was a little buy in-between by investors who are having fear of missing out which made them buy the market at the top. At the start of the EWT most of the investors who bought high would have sold low. This is the essence of using technical tools. From the chart at the end of sub wave c a good investor will then buy into the market to prepare for the bullish market. This would yield a lot of profit for the investor.
Thank you @fendit for the lesson and @steemcurator02
@fendit @fendit @fendit please revised my post it is 5days old. @fendit
Thank you for being part of my lecture and completing the task!
My comments:
I'm not really convinced by this work.
The explanations could have been way better and there was almost no development on the concepts we discussed in class.
Overall score:
4/10