Steemit Crypto Academy Season 2: Week4 |Homework Post for Professor @kouba01, Cryptocurrency Trading with RSI
Relative Strength Index (RSI); How is it Calculated?
Relative strength index (RSI) is a popular trading tool used to facilitate low risk transaction in the stock and crypto currency markets. It is a price momentum oscillator which is used to forecast market trends. It is a reputable technical indicator that tracks oversold and overbought assets by analyzing the speed of price movement. It was developed by the notable American analyst Welles Wilder Junior. He did so in by comparing latest gains in the trading market to the recent losses made in the market through a complex formula that luckily we do not need to know now.
RSI puts at trader’s disposal readable signals about bullish price momentum and bearish price momentum, thereby aiding trading success. It is easy to use. In simple terms, RSI helps to survey the market and thus determine when it is cool to buy or sell and when it is not good to buy or sell. It provides signals which inform traders to buy when a crypto currency is oversold and to sell when it is being overbought.
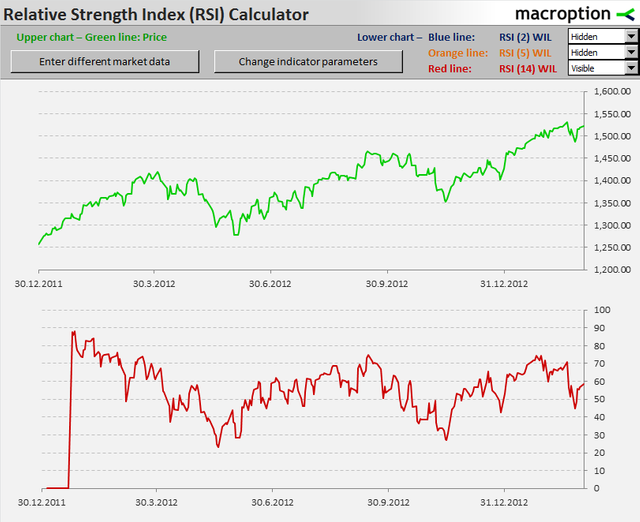
It is a very essential tool most especially for the beginners to crypto trading in the financial market. The chart below has RSI configured in it; hence you can see the RSI rise and fall as it tracks the price momentum of a crypto.
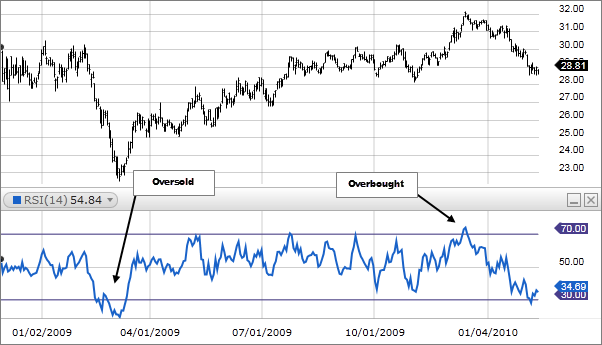
Know that the value in the RSI chart ranges from scale 0 to 100. If reading is 70 and above, it is interpreted as overbought or overvalued. There may be reversal in trend or price pullback so you may sell. At 30 downwards, it is considered oversold or undervalued.
HOW IS IT CALCULATED?
We calculate the RSI by using the average price gains and losses in a given period of time. note that the period by default is 14 periods ranging from 0 - 100.
It has a formula which is:
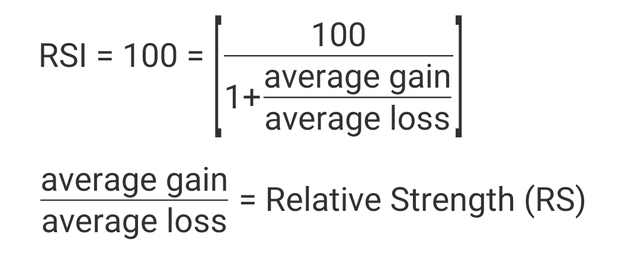
Change the Relative Strength (RS) to index between 0 - 100.
The default period being taken into consideration for the calculation is usually 14 periods.
Take a look:
Average gain = sum total of gains over the past 14 periods/14
Percentage loss = sum total of losses over the past 14 periods/14
RSI takes into consideration previous calculations implying that RSI values gets more accurate as the period of calculation extends.
Trust on Crypto currency. Why?
The crypto currency market is a highly volatile market such that traders and investors rely on varieties of tools to master the art of trading so as to minimize losses. These tools help to identify when to buy and sell signals and show the way to go. And one of these tools is RSI.
In as much as RSI has a lot of strength in determining buy and sell signals, it is lagging and not totally to be trusted. RSI tends to generate false alarms in terms of false buy and sell signals. It cannot generate 100% accurate reading. Though how great the indicator is also depends on the skills and knowledge of the trader who reads it.
To get true or genuine reversal signals are very rare. The signal can be overbought or undervalued for a long period of time even when a crypto has gained substantial momentum in either direction. Given these, it should be noted that no technical indicator is 100% reliable and efficient. They are just one of the tools to be used. Hence RSI should be used along with other trading tools to avoid losses.
How To Configure The RSI Indicator On The Chart.
The indicator or oscillator is in most trading platform so you got nothing to worry about. There are a couple of ways to configure the RSI indicator on the chart.
The simplest way is by clicking the tab:
“Lists of Indicators”This can be found on the upper panel of the terminal and then choose: “Oscillators”– “Relative Strength Index” These steps are presented in the screenshot below:
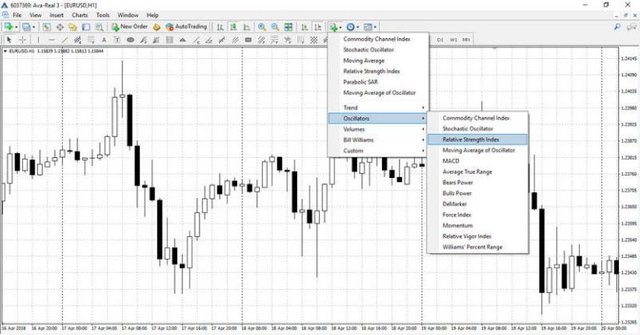
The second way is by choosing: “Insert” then “indicator” – **“Oscillators” **then “Relative Strength Index” These steps can be seen in the shot below:
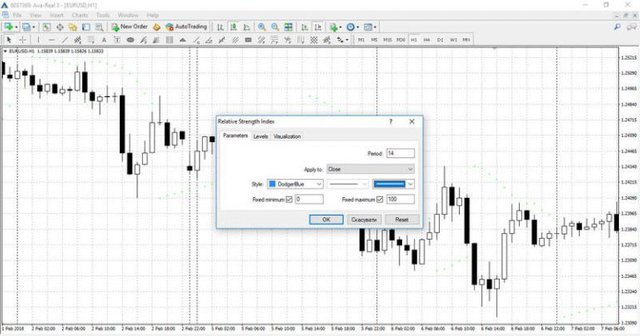
The instrument configuration window bar will open up before the RSI is configured into the chart the window enables you to set the RSI parameters.
Parameters
The length parameters can be referred to as the given period. It is the number of candle sticks that the indicator analyses to show the average value. Generally, the default timeframe is usually 14 which mean that the price momentum or change for the last 14 periods is considered. The length parameter determines RSI stability and volatility and how fast is will respond to the changing market conditions.
Why is it equal to 14 by default?
The length period is so because it is thought that in a longer timeframe, the chart will generate fewer trading signals however it will have greater level of trust and reliability. But for shorter span like 14 days, more signals will be generated though a lower level of reliability.
Can it be changed?
Yes, it can. This is evident in the fact that some experts are of the belief that the best time frame is between 2 to 6 periods as they can up or down the values considering their position. Also, they believe the 14 periods setting generates inconsistent trading signals. Hence, they tune it lower to augment the sensitivity of the indicator. Yet, some long term traders set to more than 14 periods because it suits them.
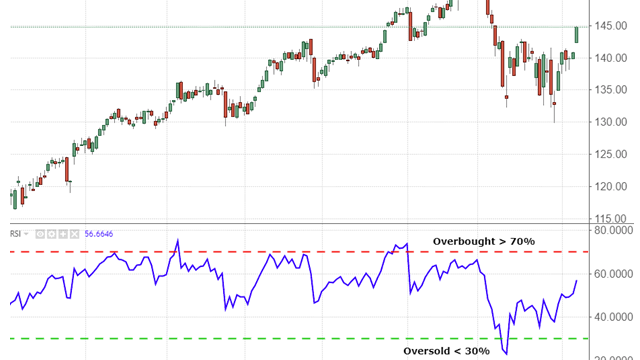
Overbought
In trading crypto, overbought is a situation when RSI approaches levels 70 or above. This suggests that the gains exceed the loss over the period. It may be due for trend reversal or pullback. Some may tell you to sell at this point as it is bullish.
Oversold
Oversold, which could mean unvalued is when the RSI is in the value of 30 or below. It is considered bearish.
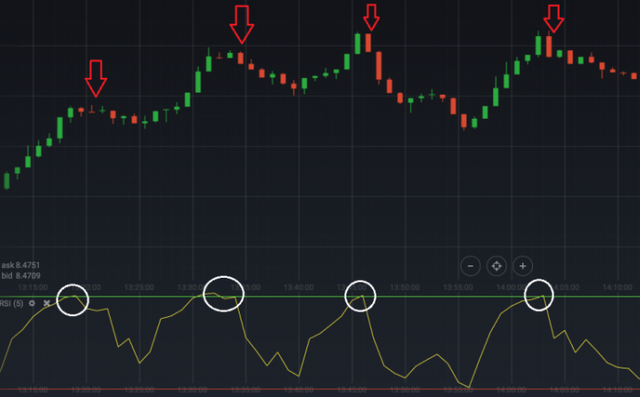
In order to get good result from RSI, you need to filter it to avoid fake alarms.
How?
Reduce RSI to minor timeframes. It could be a period of 5 on a one minute chart like it is in the chart below.
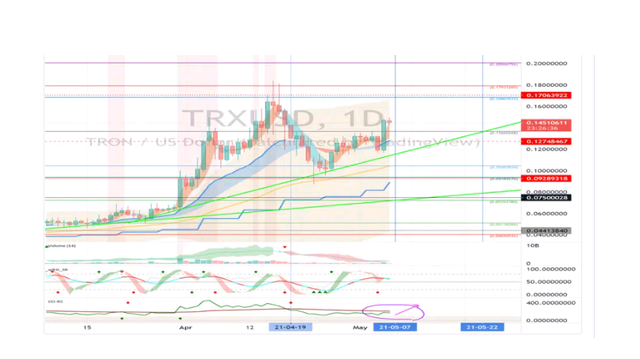
This is a RSI chart of the TRON/USD trading as of May 7th 2021. The volatility should be monitored as there is a little dip. It is on a bearish trend as indicated on the RSI, though going up. It is time to buy.
Thank you @kouba01 for the lesson and @steemcurator02
Hello @gboye1,
Thank you for participating in the 4th Week Crypto Course in its second season and for your efforts to complete the suggested tasks, you deserve a 4/10 rating, according to the following scale:
My review :
The article lacks many aspects, as your role is limited to summarizing and paraphrasing the information. The RSI technique must be applied to some examples in order to understand the importance of using it and to be able to analyze price changes.
Thanks again for your effort, and we look forward to reading your next work.
Sincerely,@kouba01