[Technical Indicators] - Crypto Academy / S4W2 - Homework Post for @reminiscence01
Without any further ado, I will immediately get into the assignment of the day. I will be writing on the assignment given by @reminiscence01. @reminiscence01 lectured on Technical Indicators and after going through the class, I must confess that I learned a lot. Allow me to immediately get to the assignment.

Technical indicators and why it is a good technical analysis tool.
This isn't new to anyone who has been trading for a while now as technical indicators are very important for traders when trading with technical analysis. Technical indicators are mathematical expressions of past price movement in a chart, which are illustrated in patterns or charts to predict a possible future movement of the price.
Technical indicators are formed basically through price movement with respect to time, this movement can be the open/close price of an asset at a given time, volume, and so on. With technical analysis, it is easy to identify analyze trends, price movements, volatility of the market, and many more.
Are technical indicators good for cryptocurrency analysis
When trading with technical analysis, it is no doubt that chart reading is very important but then, these charts can be eaning so many things. A chart could lead to an uptrend or a reversal but one thing is certain about trends, it shows a good entry point which is determined by the chart but to confirm the action to be taken, there needs to be a confirmation and this is where technical indicators come into place. After looking at a chart with candlesticks of ups and downs, and charts (which people see differently), technical indicators interpret the chart in a simple easy to read term giving a confirmation of a trade.
Illustrate how to add indicators on the chart and also how to configure them. (Screenshot needed).
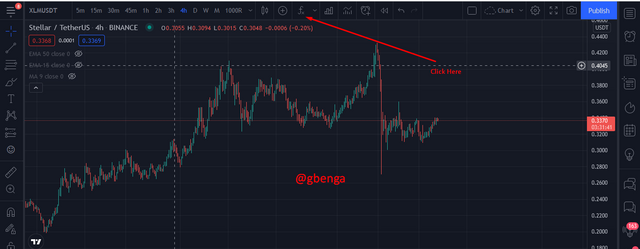
To illustrate how to add indicators on charts, I will be using the Tradingview platform. I will be adding a few indicators to the chart, and the first one is the Moving Average. Moving Average is used to find the average closing price of a pair at a given period of time on the chart. The Moving Average is represented as a straight line on the chart and the smaller the time period of the moving average, the more volatile it is while the more time period a Moving Average (MA) looks at, the less volatile it is. To add the Moving Average to a chart on Trading view, the indicator button is clicked on.
After clicking on the indicator button, a list of indicators will appear after which you can search for Moving Average (MA)
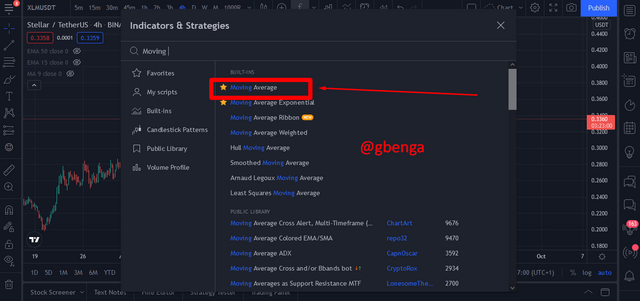
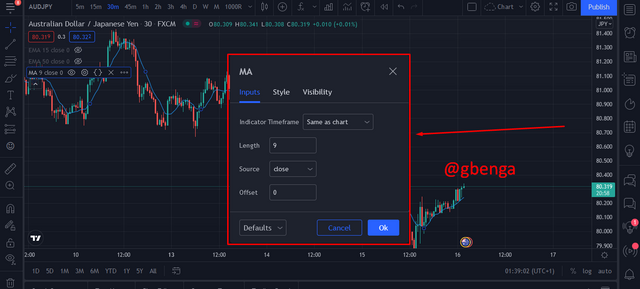
The Moving Average always appears in default of 9 days moving average period which is often volatile and meant for short-term trends. Commonly, 9 days to 50 days moving average are used to spot short term changes in trend, 50 days spot medium-term changes while 100 days to 200 days are for spotting long term changes.
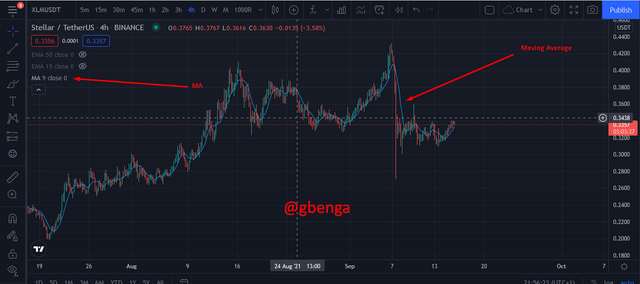
In other to change the MA period, you click on the MA setting menu and there the period can be changed. The changes can be done on the period, the timeframe, MA source (opened/closed, high/low, and so on).
Explain the different categories of Technical indicators and give an example of each category. Also, show the indicators used as an example on your chart. (Screenshot needed)
Trend Based Indicator/Trending Indicator
Just as the name implies, a trend-based indicator is an indicator that follows the trend of the chart. Traders who trade with the trend are known to be very successful as trading with the trend is just like sailing along with the gentle tide. If a trader gets into a trade early, it is very possible that the trader will benefit from the trade.
An Example of trend-based indicators are Moving Averages
Moving Average
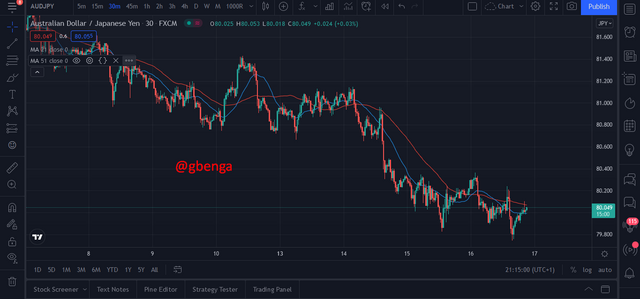
The moving average is used to determine the direction of the market pair. It can be used to determine support and resistance. The MA line is drawn by finding the average closing price of the trading pair at a particular time. The result is a line that follows the price movement of the trading chart. Moving Averages can be volatile or not volatile depending on the period set on the Moving Average
Example: Using the 21MA and the 55 MA are very good Moving averages to determine the trend of trade. The 21 MA to see short-term trends and 55 MA for medium-term trends.
Momentum Based Indicators/Oscillators
This indicator is used to determine how strong a trend is and when the trend is due for a reversal. Since the market would never go in a straight line but rather go up, down, and sideways, then it is no doubt that a price trend will never remain bullish or bearish for a long time and so when the Momentum-based Indicators/ Oscillators are at a high, then the pair is overbought and when it is jow on the other hands, it is oversold. This often gives a call for when t buy and when to sell.
Examples of Oscillators are Moving Average Convergence Divergence (MACD), Stochastic, Relative Strenght Index (RSI), **Commodity Channel Index (CCI)
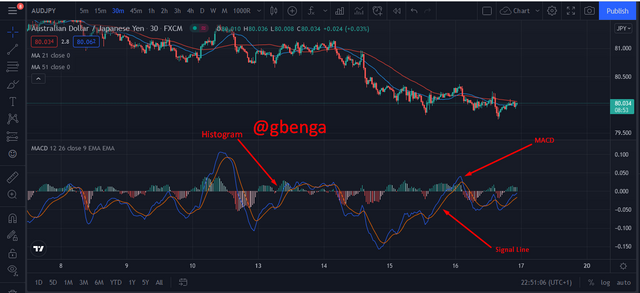
Moving Average Convergence and Divergence (MACD), developed by Gerald Appel is an oscillating indicator used to determine the momentum of a trade showing the bullish, bearish, overbought, and oversold point of the trade thereby confirming reversals in trades.
MACD is a combination of Moving averages 12- period EMA and 26-period EMA, and a signal line of 9-period EMA and a histogram. When the MACD crosses above the signal line, then it is a good time to buy, and when the MACD crosses below the signal line, then it is a call to sell.
Volatility Based Indicators
This indicator is used to identify changes in the price of an asset over a given period of time. Just as the name implies, it is used to check for volatility, and the faster the price of an asset changes, the more volatile it is, and when it is opposite, it means it is less volatile. Examples include Bollinger Bands (BB), Donchian Channels, and Keltner Channels (KC)
Bollinger Bands (BB): Discovered by John Bollinger, it consists of three lines with the middle line having a 20-period Simple Moving Average (SMA), The Bands are a combination of 20 SMA and Standard Deviation (SD)
Middle Band: 20-period SMA
Upper Band: 20-Period SMA + (SD x 2)
Lower Band: 20-Period SMA - (SD x 2)
Briefly explain the reason why indicators are not advisable to be used as a standalone tool for technical analysis.
Indicators are not a standalone call for an entry or an exit to a trade, indicators are meant to be a confirmation to a chart (which is the underlying thing formed by the candlesticks). Multiple indicators can be very confusing as different indicators can mean different things and so, using these indicators at once could give a false reading which could cause the trader to lose money. In other to get the right result, traders should use technical analysis tools such as charts, understanding trends, and using 2 indicators to confirm a trade.
Explain how an investor can increase the success rate of a technical indicator signal
To increase the success rate of trades with technical indicator signals, traders need to be able to understand major candlesticks, analyze the chart and interpret them, use 2 indicators to determine/confirm the trade, know the entry and exit point of a trade. Money and risk management are very important when trading with technical indicators, emotions and not knowing when it is enough can bring severe ruins to a trader and as such, it is good that the trader adheres to all these to have success while trading.
Conclusion
Trading isn't gambling, it is a business that has to do with money and so it should be taken as such. if a trader doesn't do the required thing before performing a trade, it is visible that such a trader will lose money as it is called gambling. Indicators can be regarded as trading blessings allowing the trader to confirm trades, but then, they should not be used alone.
I must confess that I had a good time going through the class and participating in the assignment. I hope to be a part of the next class.
Hello @gbenga, I’m glad you participated in the 2nd week Season 4 of the Beginner’s class at the Steemit Crypto Academy. Your grades in this task are as follows:
Recommendation / Feedback:
Thank you for completing your homework task.