Steemit Crypto Academy Season 5 - Homework Post for Task 10

1a) EXPLAIN THE JAPANESE CANDLESTICK CHART? (Original screenshot required).
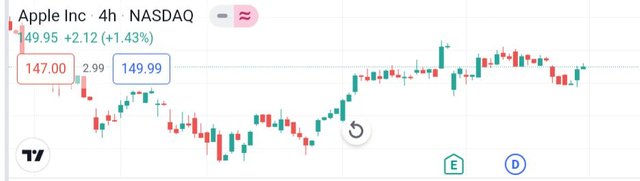
The Japanese candlestick is a tool that is used in technical analysis. It is used in the analysis of movement in price of assets and securities. Candlestick theory was initiated by a then rice trader in Japan by name Munehisa Homma. He observed and established that even though demand and supply played a major role in the price of rice, that the market price was greatly influenced by emotion.
Candlestick is a graphical representation of of how the price of an asset is moving which is usually displayed with using different candle colors. This various price movements is used by traders to make entry and exit decisions. The Japanese candlestick chart is used as a technical indicator to speculate the next price direction of an asset via emotion psychology study.
Four main statistics can be drawn from a candlestick and they are;
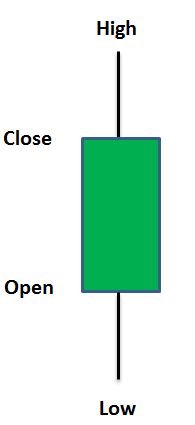
• Open
The price at which a candle began in a given time.
• high
The maximum price attained by an asset in a given time.
• Low
The minimum or lowest price attained by an asset in a given time.
• Close
This refers to the price an asset ended with in a given time.
b) IN YOUR OWN WORDS, EXPLAIN WHY THE JAPANESE CANDLESTICK CHART IS THE MOST USED IN THE FINANCIAL MARKET.
Some other charts like bar chart give similar price information to traders but in another graphical representation. Yet, traders prefer to use the Japanese candlestick chart. **This is because of the underlisted reasons
1. Extra price movement information
Traders prefer the candlestick because of the extra details which it is able to display**. Candlestick displays a clearer visuals of the price action. Candlestick also tries to show graphically some factors that influence the price action such as demand and supply.
2. Candlestick charts are customizable
Candlestick are very elastic such that one candlestick can be used to represent price actions of any time frame(2 hours, 1 week, 3 months etc) of a given asset.
3. Operation with indicators
Most indicators are best suited to work with candlestick chart. Now, if one of this indicators is required by a trader for trend identification, then he must surely employ the candlestick chart as well
4. Easy to Understand
The candlestick chart is pleasing to the sight and with it's mixed colors, it is not difficult for one to know where there is bullish or bearish in the price of an asset.
5. Helps to Read the Market Psychology
The candlestick chart helps a trader to be able to identify who is really controlling the market at any given time. Candlestick helps a trader to determine the market bias and hence calculate his market entry and exit points.
c) DESCRIBE A BULLISH AND A BEARISH CANDLE. ALSO, EXPLAIN IT'S ANATOMY. (Original screenshot required)
Bullish candlestick
.jpg)
A bullish candlestick is one that has its closing price above its opening price in a given time frame. In other words, the close did not settle below the open hence the asset gained value and its price increased. It is usually identified by a green or white candle. A dialy example; assume that you bought a token for $100 at the beginning of a candlestick( open price) and then four hours later you sold the token for $110 still in the same candle ( close price). Now it can be seen that the close price is above the open price hence this candlestick is called a bullish candlestick. It denotes an Uptrend.
Bearish Candlestick
~2.jpg)
A Bearish Candlestick is one that has its opening price above the closing price in a given time frame. In other words, the asset lost value and consequently price in that time frame of the candlestick. It is usually identified by a red colored candlestick.
Conclusion
Japanese Candlestick is a technical analytical tool that is used to predict the outcome of a market price action. Ever since it's inception, it has become a useful tool in financial trade analysis. Today, almost all traders of Cryptocurrencies use this candlestick for their daily Trading analysis.
Regards to professor @reminiscence