Crypto Academy /Season 3/ Week 2 / Homework Post for Professor [@reminiscence01] || Introduction to Trading Charts

(1) Explain the Japanese Candlestick Chart? (Chart screenshot required)
The Candlestick chart origin was from Japan at about 100 years before the development of the point-and-figure chart and bar chart by the west. A Japanese man by name Homma established that although, the market price was in link with the supply and demand volume, traders emotions also greatly influenced the market price.
.png)
p
Traders make use of the candlestick chart in deciding their trading choices based on frequently occuring market trends in a given time frame.
Components of Candlestick
Candlestick reveals the markets open, low, high and close price for a given time frame. There is also the wide part of the candlestick known as the real body.
.png)
p
• The range of the opening and closing price for a given time frame is represented by the real body.
• The open signifies the open price of the market at a specific time frame
• The close signifies the closing price of the market at a specific time frame
• The Low signifies the lowest market price at a specific time frame
• The high signifies the highest market price at a specific time frame

(2) Describe any other two types of charts? (Screenshot required)
Bar Chart?
.png)
p
A Bar chart is made up of multiple price bars, and every individual bar displays how an assets price increaed or decreased in value within a given time frame. A good bar chart will show the open, close, high and low price points of a given asset.
The Bar chart helps traders to analyze trends, monitor price movement and Volatility, and spot potential trend reversals.
Bar Charts Interpretation
Like in a candlestick, a bar chart displays the open, high, low, and close prices in a given time frame and so traders could gain lots of information from these to help them forecast and trade gainfully.
.png)
P
• A Long vertical bar indicates that there was a big increase in price of the asset while a small vertical bar will indicate that very very small increase has occured.
• A long line gap between the open and close implies that the price moved significantly.
• • If the close is at a distance above the open, then it simply indicates that there were more buyer in this time frame and a subsequent price increase.
• If the distance between the close and near is negligible, then it means that buyer did not show much Interest in the market in this time frame.
Line Chart?
A line chart displays graphically the history of an assets closing price and it achieves this by connecting various data points using continuous lines. This is the most common type of chart that is used in analysis of finance and it mainly shows the closing price in a given time frame
.jpeg)
P
A line chart shows a trader a vivid view of where and how the price of an asset has moved in a given time frame.. Because of the closing prices which line charts only show, it reduces stress from analysing times that are not so critical in the trading day. Line chart is well known and used by traders because of course everyone is interested and in the closing price which the line chart offers at a glance.
(3) In your own words, explain why the Japanese Candlestick chart is mostly used by traders.
The candlestick chart is widely used by traders because of the following reasons
.jpeg)
Lots of information
Because of how the candlesticks present the open, close, high and low details of a coin in a particular timeframe, it makes it one of the pure and most accurate charting forms and also displays data in an attractive style.
Easy to understand
To look at candlestick chart on a screen is very pleasing with it's customizable outlines and colors at disposal to users. Any user can customize the candlestick to to please his view.
Indicators
In the candlestick chart, most indicators funtions better. Oftentimes when indicators are required for technical analysis of a peculiar trading system, the candlestick chart is used.
Market Psychology and Sentiment
Candlestick charts are best in showing who is currently controlling the market in a perticular time frame. Using the different candlestick patterns, a trader can easily determine the trading psychology and overall bias in a given time frame.
(4) Describe a bullish candle and a bearish candle identifying its anatomy? (Screenshot is required)
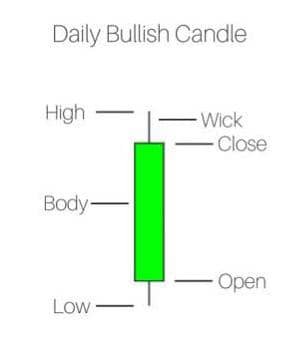
Bullish candlestick
A bullish candlestick will display that there is an increase in the price of a commodity. It can be identified when the closing price settles and closes above the opening price.
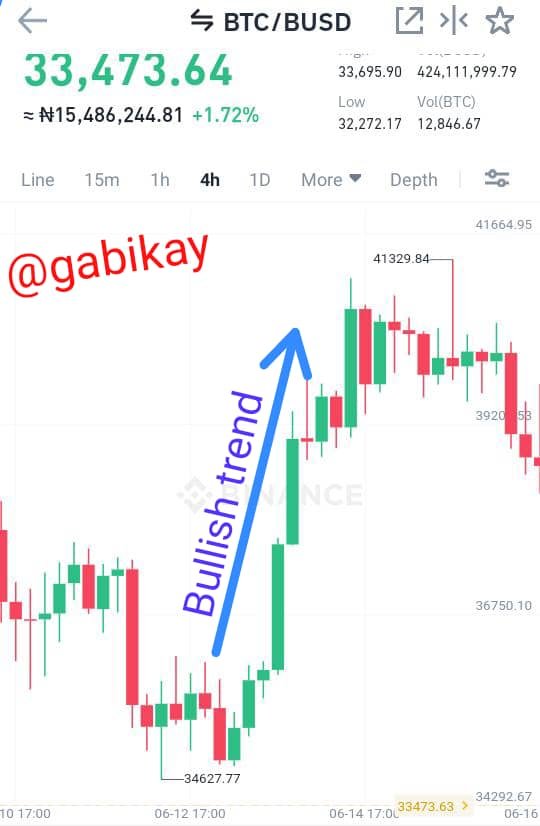
(Screenshot from Binance app)
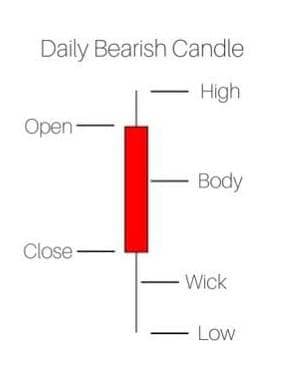
Bearish candlestick
Bearish candlestick indicates that there is a decline in the price of a particular commodity in the market at a given time frame. It can be identified when the closing price settles and closes below the opening price.
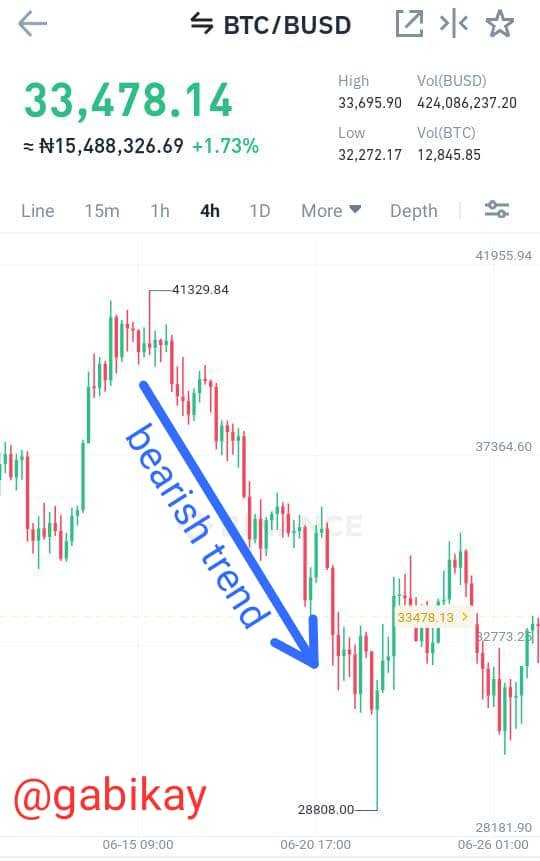
(Screenshot from Binance app)
Conclusion
• A trading chart is a graphical representation of different price moves of an asset in a given time frame. It shows very useful data that could be instrumental in guiding a trader to decide when to buy or sell in the crypto market and beyond.
• There exist different trading charts but most of them give 4 important details which include the open, high, low and close price of the asset which they tell about.It is necessary that a trader learns and knows how to read and analyse a trading chart to be able to trade successfully.
• Candlestick is a type of trading chart that makes use of candle sticks to graphically show the detailed price movement of an asset with time.
Regards to professor @reminiscence01
Hello @gabikay , I’m glad you participated in the 2nd week of the Beginner’s class at the Steemit Crypto Academy. Your grades in this task are as follows:
Recommendation / Feedback:
You did a good work in explaining Japanese candlestick and its anatomy. Thank you for participating in this homework task.