Crypto Academy / S5W1- Homework Post for @reminiscence01".
.jpeg)
- a) What do you understand by a Trending market?
b) What is a bullish and a bearish trend? (screenshot required)
Trending Market
A market trend refers to the upward or downward direction move of a crypto asset. Market trend is a graphical representation of how the market behavior and statistical data affects the price of an asset. Trending market refers to the upward swing or downward swing in the price of an asset which corresponds to the increase or decrease in the price of that asset.
Bullish Trend
When the price of an asset continues to increase in the presence of price retest at different time interval, then the graph that is formed is said to be a bullish trend. As it is known, no assets price just continuous to increase. The price must decrease and then increase (for bullish) because of the crypto volatility. A bullish trend can be spotted when an asset price closes above its previous close consecutively.
Bearish Trend
This is usually associated to an assets loss in value. When an assets price closes below it's previous close price consecutively (back-to-back), then we can say that the asset is in a bearish trend.

- Explain the following trend identification and give an example of each of them. (Original screenshot needed from your chart). Do this for a bullish and a bearish trend.
i) Market Structure.
ii) Trendlines
Market Structure
Market structure refers to the commonest form of price movement of an asset. Market structure studies the swing lows, swing highs and resistance and Support levels of an asset to determine the price action of the asset.
Bullish Trend (using Market structure)
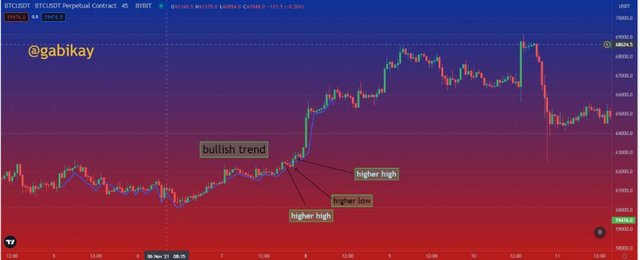
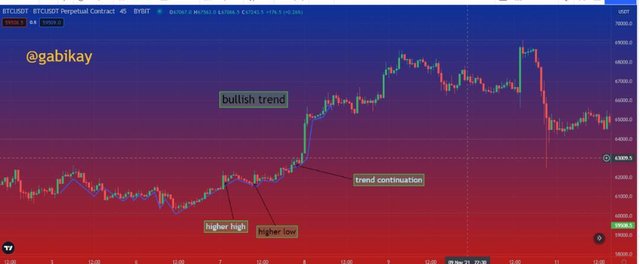
A bullish market structure can be identified when the assets price makes consecutive higher highs and higher lows. This means that for a bullish structure the price of the asset must not close somewhere around the previous close. Also, in this structure it is permitted for the price to close a little below the new high but never below the the previous high. When this goes on and on for atleast 4 times, then we can say that a bullish trend is formed.
Bearish Trend (using market structure)
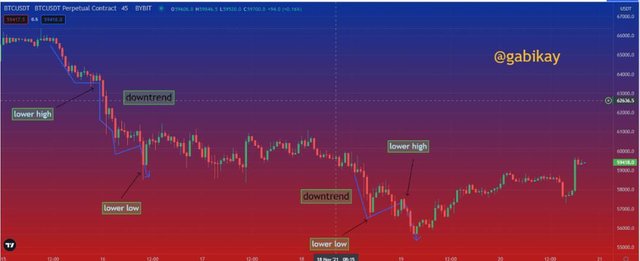
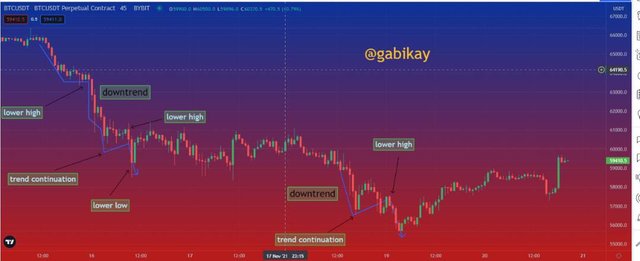
When an asset price consecutively makes lower highs or lower lows. In this way, the closing price of the asset now will be lower than it's previous close and the next close will be lower than the close now. Even if it goes above the close now it will never get above the previous close.
Trendline
Trendline is a popular and cheap tool which is used in the determination of the trend of a market. It is a line which is places on atleast 2 points on the resistance or support level of an asset price chart and then this line is drawn into the future.
Bullish Trend (using Trendline)
This is obtained by placing the Trendline along two points at either the support level and then draw the line to the future. If this line goes upward, then the trend can be called a bullish trend.
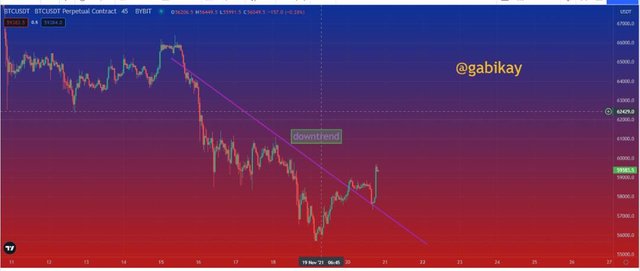
Bearish Trend (using Trendline)
This is obtained by placing the Trendline along two points at either the resistance level and then draw this line to the future. If this line goes down the slope, then we have a bearish trend.
- Explain trend continuation and how to spot them using market structure and trendlines. (Screenshot needed). Do this for both bullish and bearish trends.
Bullish Trend continuation (using Market structure)
When we spot a bullish trend using market structure, we can observe that there is a particular characteristic that makes it continue in its bullish direction. This feature is called the trend continuation. When an assets price makes higher highs and higher lows consecutively, at the point where it makes the higher low before making another higher high, we can call that point a trend continuation
Bearish Trend continuation (Using market structure)
When an assets price makes a lower high and lower low consecutively, the lower high point can be said to be the trend continuation of the bearish chart. This is because the price wanted to breakout but could not go beyond the previous high hence the price continued in its bearish direction.
Bullish Trend continuation (using Trendline)
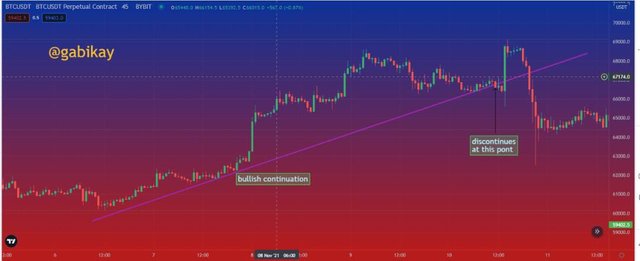
When we use a trendline to spot a bullish trend, it can be observed that the Trendline touches atleast 2 points at the support level. If this trendline continue to go up without being penetrated (bisected) by any price action, then we can say that there is a bullish trend continuation.
Bearish Trend continuation (using Trendline)
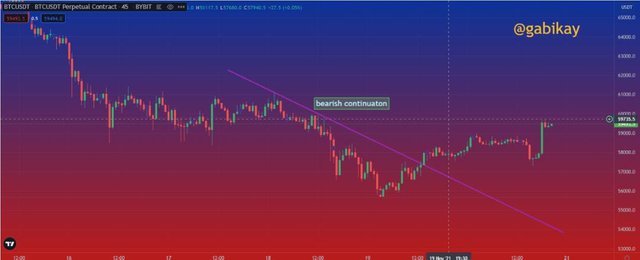
When a trendline is used to spot a bearish trend, it can be seen that the Trendline touches atleast two points of the resistance level. If this trendline that is drawn to the future is not bisected by any price action while going in the bearish direction, then we can say that the asset is in a bearish trend continuation.
- Pick up any crypto-asset chart and answer the following questions -
i) Is the market trending?
ii) What is the current market trend? (Use the chart to back up your answers).
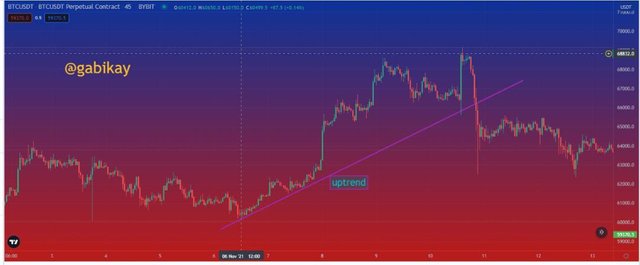
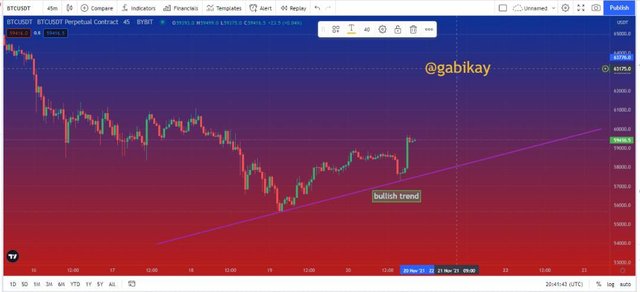
I have chosen a BTCUSDT pair for a time frame of 45 minuites. Observing the chart below, one can easily spot that the market is trending and it is of a bulisih trend. I have used the Trendline to show that the market is in a bullish trend.
- Conclusion.
It is evident that the market trend is an essential knowledge supposed to be owned by the trader and so cannot be overlooked. Like a saying goes that it is unwise to swim against the water current, so is it unwise and very risky to trade against the market trend.
Market structure and Trendline are basic technical analysis tools that every beginner in trading should have.
Regards to professor @reminiscence01
Hello @gabikay, I’m glad you participated in the 1st week Season 5 of the Beginner’s class at the Steemit Crypto Academy. Your grades in this task are as follows:
Recommendation / Feedback:
Thank you for submitting your homework task.
Hi professor @reminiscence01, this is the 6th day of my homework post but it has not been curated by @steemcurator02
Thanks for your concern