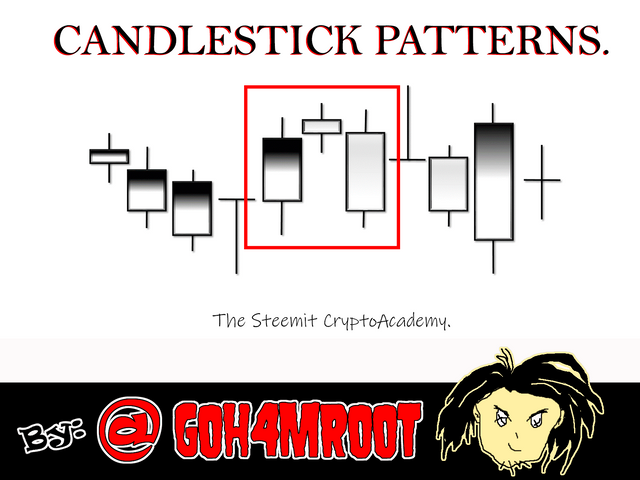
Steemit Crypto Academy Season 3 Week 4 - Beginner's Course | Candlestick Patterns by @g0h4mroot for the Cryptoprofesor @reminiscence01.

Bullish engulfing candle pattern.
Doji candlestick pattern.
The Hammer candlestick pattern.
The morning and evening star candle pattern.
The morning and evening star candle pattern.
.png)
Bullish engulfing candle pattern.
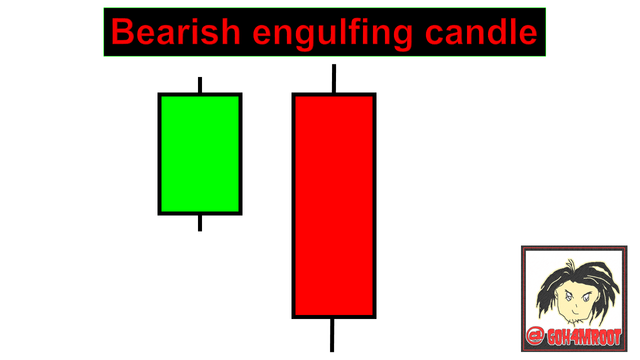
The bullish engulfing candle pattern is created after a bearish market move. assuming that the price has fallen in the last 6 candles and candle # 7 begins to open, for there to be a change in price trend, candle 7 must exceed the size of the previous candle, wrapping it in its entirety and doubling its size.
that is, the # 6 candle, is a red candle, the next candle, which is the # 7 candle, must exceed the red candle above its opening.
If this happens we are facing a bullish engulfing candle pattern, from then on the value of the asset will change and the price will begin to rise.
This pattern, apart from showing an evident change in trend, indicates that there are no longer people interested in selling and most of the orders have been taken by buyers.
.PNG)
Doji candlestick pattern.
This type of candle pattern is created by indecision in the market, indicating that traders do not know what to do, this type of candle opens and closes at the same price, they are rare and have no body, their name is translated from Japanese and indicates error, says that the name is given by Japanese traders.
there are 4 types of doji:
Candles neutral doji
This candle is formed because the initial price is identical to the closing price, it is formed in the middle of the candle creating a cross, this pattern indicates that buyers and sellers cannot change the price in their favor, it indicates indecision.
.PNG)
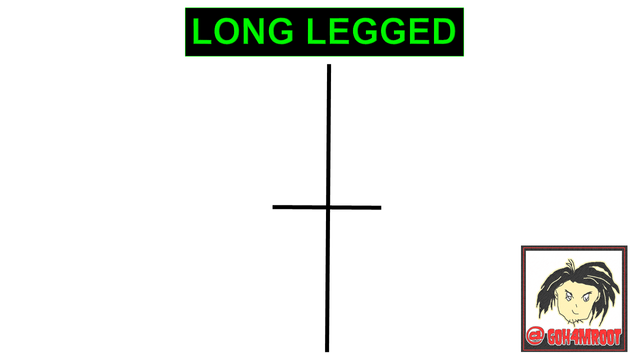
Long legged doji.
It is identical to the neutral doji candle only that the price fluctuates more, and indicates indecision.
Doji gravestone.
This candle is formed when the initial price and the closing price are set at the lowest part of the candle or at the bottom of the candle, when it appears there is likely to be a trend change from bearish to bullish.
.PNG)
Doji dragonfly.
This candle is formed when the initial price and the closing price ends at the top of the candle or at the maximum of the candle, just as the gravestone candle indicates a change in trend, in this case the trend would start to be bearish .
.PNG)
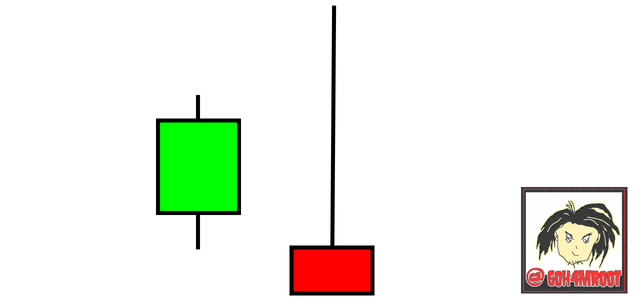
The Hammer candlestick pattern.
The hammer candlestick pattern is created when the closing price is very close to the starting price of the candle, these patterns indicate reversal in prices, to know that it is a hammer candle, the shadow should be at least twice the body, if these candles appear on the support and resistance trend lines they are more effective in our analysis.
There are 2 types of hammer candles:
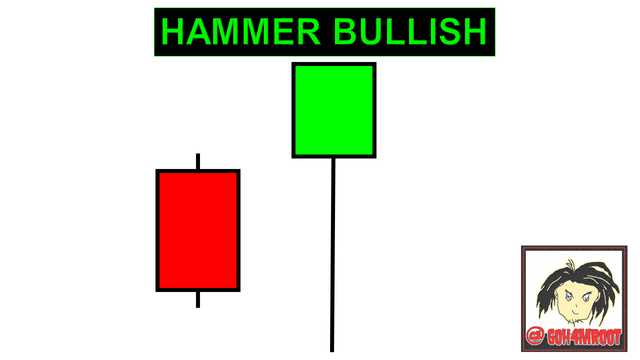
Bullish hammer.
the bullish hammer appears at the end of a downtrend, indicating a change in trend, this tells us that the sellers managed to make the price go down a lot, creating new lows before its close, the wick is long down.
Inverted hammer.
the inverted hammer, appear after an uptrend indicating a possible downtrend, indicating that sellers managed to make the price go down.
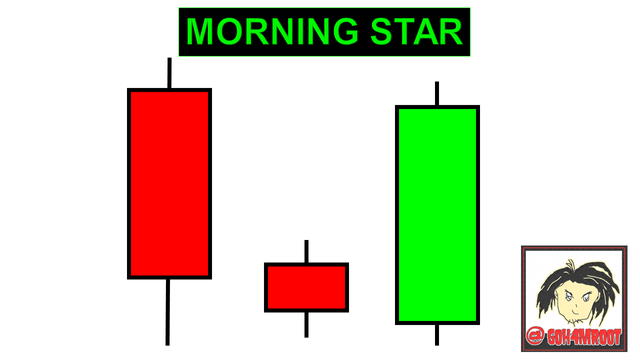
The morning star
This pattern is formed by 3 consecutive candles, a long-bodied bearish candle, followed by a small doji candle with a short wick and an engulfing bullish candle, this type of pattern indicates that the market will be the buyers and the price will rise and change the trend.
This pattern is a clear change in trend, sellers were able to keep the price high and the reversal is inevitable and buyers have now taken over the market.
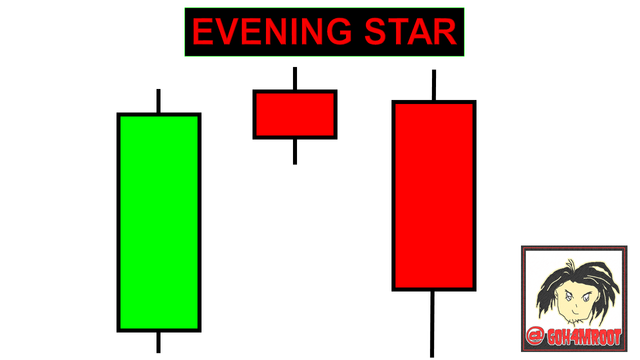
Evening star
This pattern shows a strong downward trend change, it is formed by 3 candles, the first candle is a large bullish candle, this indicates that the buyers have the power, the second candle, is a small doji candle, here you can see that the Buyers can no longer continue to raise the price and hold it for a while, and the third candle is a bearish engulfing candle, this candle must outperform the previous candle, this shows that the price is going to change.
This pattern shows the psychology behind the pattern that buyers could not keep the price up and sellers managed to dominate the market and take over and the price falls.
Identify these candlestick patterns listed in question one on any cryptocurrency pair chart and explain how the price reacted after the formation. (Screenshot of your own graph for this exercise)
- On this chart we see a doji dragonfly candle, this candle is close to resistance, and when this candle appears near a trend line, the reversal is irreversible.
In this graph we can see that the market behaved as predicted by studying the candles.
.PNG)
- This pattern shows a gravestone doji candle, this candle when it is close to a major trend line, the pattern indicates a major trend reversal, in this case it is an upward trend reversal.
In this graph we can see that the market behaved as predicted by studying the candles.
.PNG)
- The hammer candle pattern indicates a change in the upward trend, in this chart the analysis of, candles was made and we determined that the price behaved in the same way analyzed, changing the upward trend.
.PNG)
- In this graph we locate the inverted mulch pattern, this pattern indicates a downward trend change.
.PNG)
- In this chart we see a large bearish candle, followed by a small doji candle and a bullish engulfing candle, this indicates a pattern of the morning star, when the pattern of the morning star appears this indicates a significant upward trend change, and in the graph we can see that the market will behave in the manner analyzed.
.PNG)
- In this chart we see a Visperian star, this star is formed by a large bullish candle, a small doji candle and a bearish engulfing candle, when the Visperian star pattern appears, it does not warn that a downward trend change will occur irreversibly .
.PNG)
.PNG)
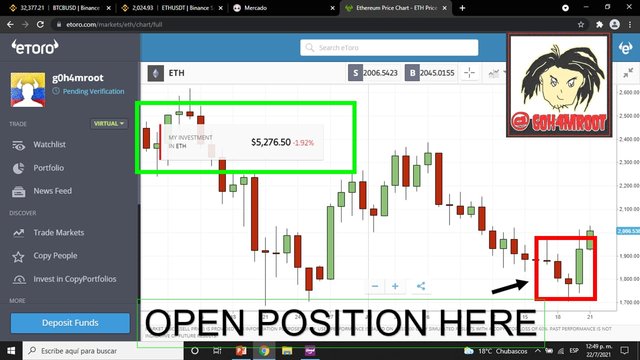
- I show my demo account on eToro, I am going to carry out a buy operation on the ETH / USDT pair. For this operation I have chosen the pattern of the morning star to make a long operation of the pair.
.PNG)
.PNG)
.PNG)
.PNG)
- This image shows the moment it enters the market.
CONCLUSION
In this class we have studied in depth about the most important types of candle patterns that exist in technical analysis, these types of patterns allow us to anticipate the market to open our operation, we study the bullish and bearish engulfing candles, we know that these candles are , they form followed by a small candle and clothe them for twice their size, we met the 4 types of doji candles, such as the neutral doji candles, the long-legged doji candle, the dragonfly doji candle and the gravestone doji, a example of the 4 doji candles.
We learned how the morning star and visperine star candle pattern is formed and it was explained with images.
Last but not least, we made a buy trade on the ETH / USDT pair with a demo account on eToro, showing screenshots and own images.
Hello @g0h4mroot, I’m glad you participated in the 4th Week of the Beginner’s class at the Steemit Crypto Academy. Your grades in this task are as follows:
Recommendation / Feedback:
You have produced a quality content. I enjoyed reading your work. Thank you for completing this homework task.