Steemit Crypto Academy Season 3 Week 2 - Beginner's Course | Introduction to Charts, by @g0h4mroot, for the Cryptoprofesor @reminiscence01.
.png)

For trading it is extremely important to analyze the market in order to operate, there are several types of analysis such as technical analysis and fundamental analysis.
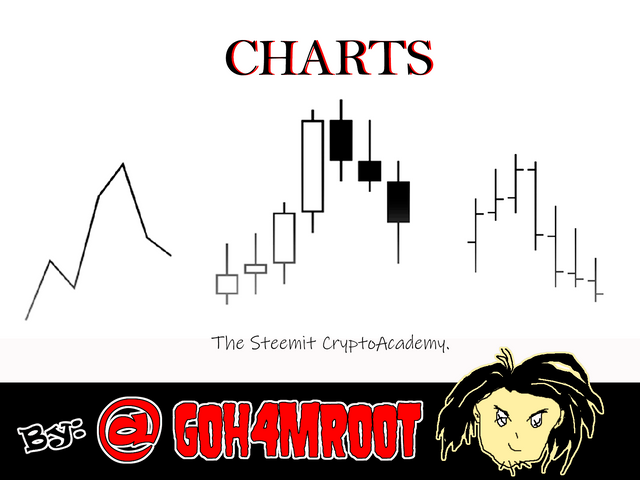
Within the technical analysis we find the study of graphics: There are several charts and one of the most important is the Japanese candlestick chart.
The Japanese candlestick chart is a way of showing the price movements of a particular asset, creating a simple and easy to understand way.
This type of graph gives us enough information to know how the market is moving in a certain time, and through its study we can determine in which direction the market could go in the future, to be able to make better decisions when operating. These candles have colors, for bullish candles they are shown in green or white, and for bearish candles red or black.
.png)

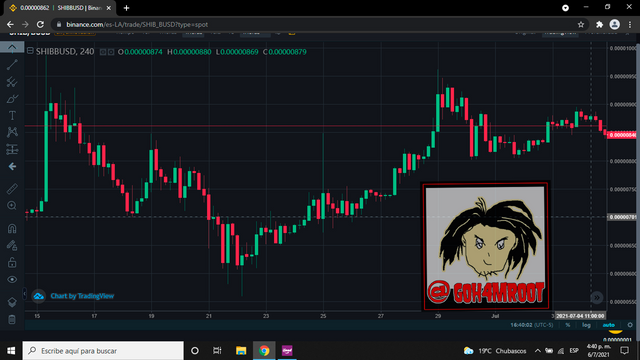
The Line Graph.
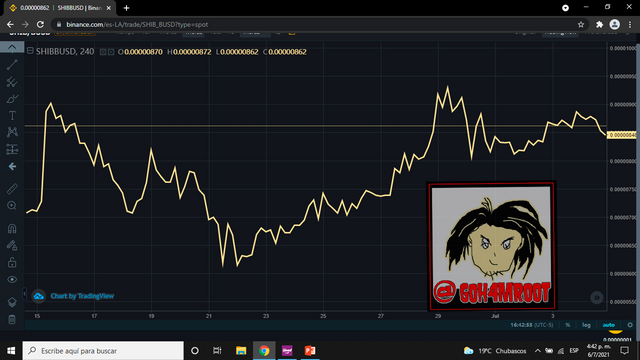
The line graph is one of the oldest and is represented by lines, these lines are worth redundancy, they move vertically in 2 directions, up or down, connecting at points to form the graph.
when the lines go up, it indicates that the value of the asset is rising and when it goes down it indicates that the value is decreasing.
They are easy to read and are one of the most important in the world of trading, many traders use them to trade in futures, as it makes it easier to determine the possible orientation of the market.
A disadvantage of this chart is that it only does not allow you to know the closing price.
an advantage is that they are simple and easy to interpret.
Bar Graphic.
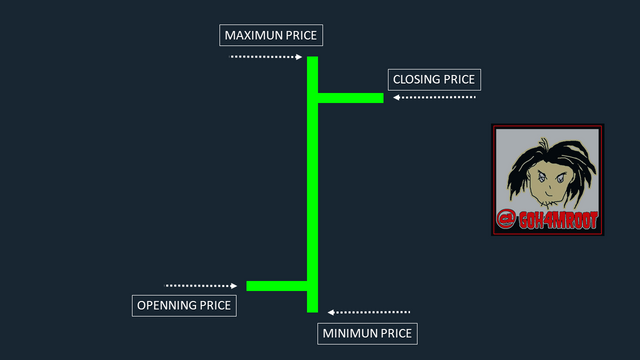
This type of chart is similar to Japanese candles, it is understood in 4 parts, indicating opening, closing, minimum and maximum.
begins to form with a bar to the right horizontally, this bar indicates the opening price, then the bar changes vertically, up or down, to determine the change in value of the asset, and finally, to determining the closing value a horizontal bar is generated to the right again.
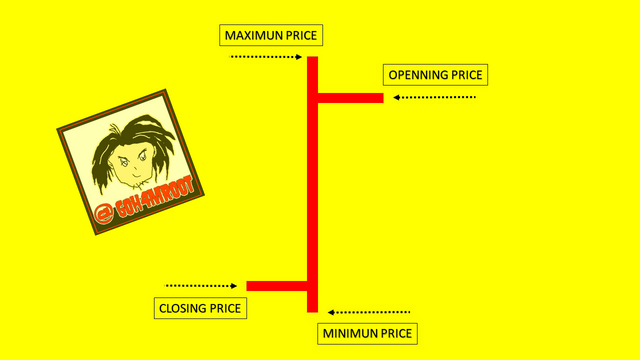
a disadvantage is that they are difficult to read because of their horizontal bars as they make it difficult to see.
an advantage is that its information is very accurate, since it shows the opening and closing price accurately.

.png)
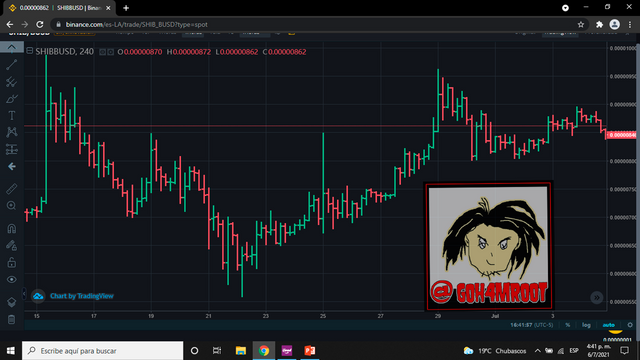
Japanese candles are the most used by traders, because in it the price orientation is clearly defined, possible patterns and price trends can be used, if it is combined with other indicators it helps us make better investment decisions.
they are easier to read, are friendly to the eye, and contain a lot of information about the asset's value. Through the candles it is known how the trader act when buying and selling.
.png)

The candles will only have 2 orientations, either up (bullish) or down (bearish).
Bullish Candle
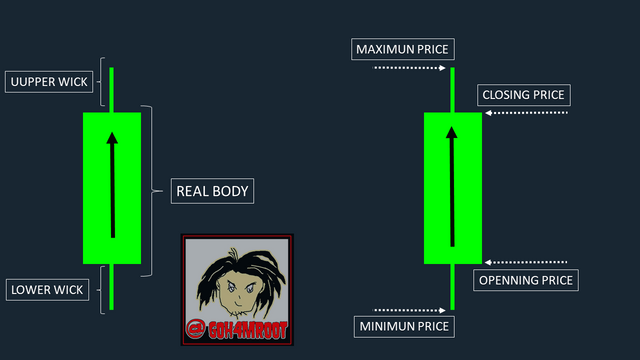
A bullish candle is one that indicates a price rise, goes from bottom to top and is represented with the color green or white, it always closes above for the initial price of the candle.
Bearish Candle
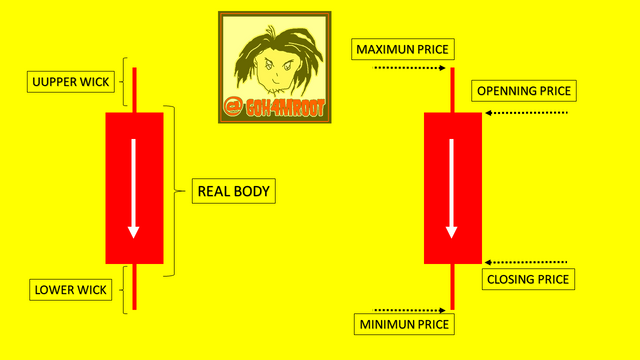
A bearish candle starts from top to bottom, and is represented by the color red or black, this candle must always close below the initial price of the candle.
The candles have 4 parts, these parts help us to identify where the price is going or where the price has moved.
a full candle shows 4 readings. Using a bullish candle as a reference, the tail indicates the lowest price at which the asset arrived, then the beginning of the body indicates the opening price, the end of the body indicates the closing price and the wick indicates the bad high price that the asset arrived during the time that the candle lasted.
There are temporalities for the candles, in a Japanese candlestick chart, these can be configured with times of 4hrs, 30min, 15min, 5 min, etc, this will depend on the trader.
the temporality of the candle indicates the time that said candle will show the price, that is, if I configure my chart at 30min, what it will do is that each candle starts every 30 minutes, that is, the time of the candle will be 30 minutes and at the end of 30 minutes the candle closes and a new candle opens, in the same way it happens if it is configured with another temporality.


In this class we inquired about the charts and their types, we got to know 3 types of charts such as the Japanese candlestick chart, the bar chart and the line chart, a proper example of the 3 aforementioned charts was shown.
We study Japanese candles, their distinctive parts and colors, and we identify through images that it is a bullish candle and a bearish candle, and we define them. A brief explanation of the bar chart was added and an image showed the parts of a bar, like Japanese candles, they have 4 parts.
We come to the conclusion that the Japanese candlestick chart is the most ideal for traders combining them with other indicators since it is very easy to understand and is very pleasing to the eye, adding that the candlestick charts cannot show possible price patterns, make this chart one of the best for traders.
We thank the Cryptoprofesor for his excellent explanation, it has been a magnificent experience.
.png)
Cc:
@reminiscence01
Hello @g0h4mroot, I’m glad you participated in the 2nd week of the Beginner’s class at the Steemit Crypto Academy. Your grades in this task are as follows:
Observations:
Rather than using the word initial price, you can say "opening price".
Recommendation / Feedback:
I'm impressed with the research you carried out to produce this content. Keep the good work up.
Thank you for submitting your homework.
Thank you professor, I will continue working to improve the quality of my assignments and my markdown!