Steemit Crypto Academy Season 5 [Advanced Course] Week 6 - Trading Crypto with Keltner Channels
Introduction
My greetings to the entire community of Steemit Crypto Academy and I hope you have enjoyed a great weekend. This is the sixth week of Season 5 at the Academy, how time flies! For this week, I will be presenting yet another lecture, and this time around, we would be discussing Trading Crypto with Keltner Channels.
Designed with Adobe Photoshop
Background to the Study
Trading in the crypto ecosystem requires different analysis which could be fundamental analysis or technical analysis, whichever chosen depends on the expertise or comfortability of a trader, and it's necessary to use a method that best suits one's expertise and which works well for one, over time. There are a lot of technical analysis tools out there today, all serving different purposes while we have some they work identically or serve the same purpose. The choice of a technical indicator for study depends on what the trader chooses to know about the market of study.
Knowing that the crypto ecosystem is associated with the volatility of crypto assets which means the measure of how much the prices of assets in the ecosystem has risen or fallen over a certain period, this is worth studying as it exposes to traders the degree of risks/profits in a market under study before such traders make an investment decision. There are several indicators used to measure the volatility of a crypto market over time and in this context, we would be looking at one of them which is Keltner Channels. Let's see what we stand to learn about this indicator.
What is Keltner Channel?
Keltner Channels was first developed by the market analyst known as Chester W. Keltner in the 1960s and the indicator was later reviewed by Linda Raschke in the 1980s, the version used today. This technical analysis tool is quite simple to use and it's effective. In the crypto ecosystem's technical analysis, it's used to measure the volatility of an asset over a certain period and works identically to some of the indicators like Bollinger bands and others.
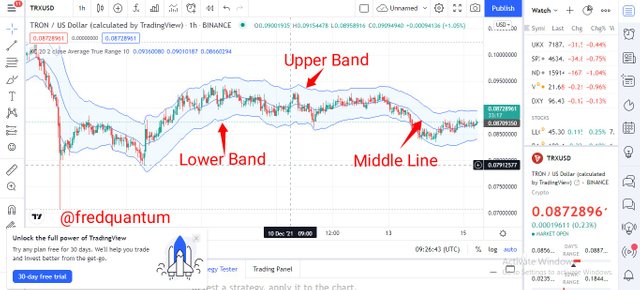
Keltner Channel is composed of three lines, where the top and the bottom lines are regarded as upper and lower bands respectively, and the middle line is an EMA (Exponential Moving Average) line. The combination of the three lines shows the behavior of the price of an asset over time and different information can be extracted such as the current trend, support and resistance, breakouts, and so on. You will get to know more about this indicator as we progress in the context.
Highlights of Keltner Channels
- Keltner Channel is a technical indicator used to measure the volatility of an asset over a certain period.
- It's composed of three lines, whereby the middle line is the EMA-20 at default while the other two lines, is set at an equal distance apart to the top and bottom.
- The setting of the upper and lower bands apart also involves a multiplier (2 at default). This is multiplied with the ATR (Average True Value).
- Different information can be extracted from the movement of the price of an asset around the channel over time; trend confirmation, dynamic support and resistance, breakouts, and so on.
How to Add Keltner Channels on the Crypto Chart
To add Keltner Channels on the chart, I will use https://www.tradingview.com/chart/ to get that done and a few steps involved would be shown below.
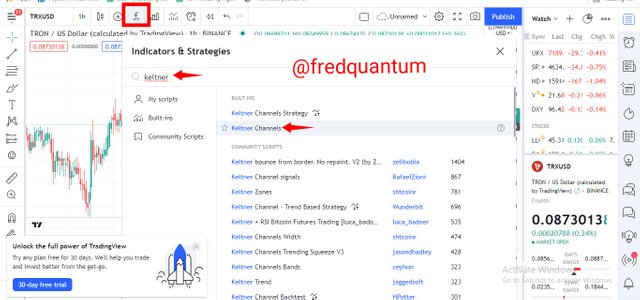
- I visited the TradinView charting platform and from the homepage, I selected fx to access the indicators.
- On the next interface, I searched for Keltner Channels and selected the indicator. The indicator is added to the chart. See the screenshots below.
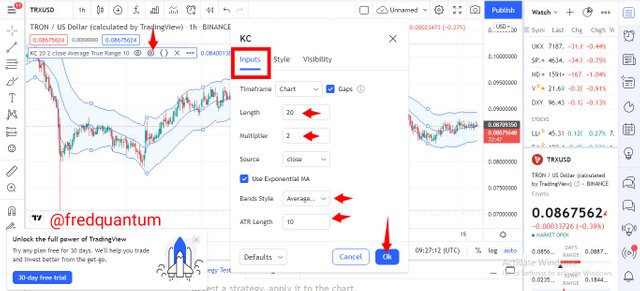
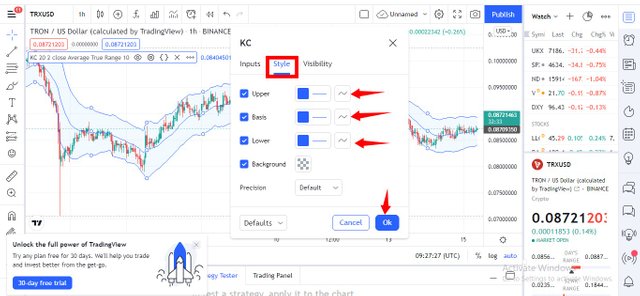
- Now, we can choose to alter the settings. Under inputs, you can alter the length of the EMA, ATR, and Multiplier.
- Likewise, under styles, you can choose to change the colors of your lines to preferred ones. I kept all the settings at default. See the screenshots below.
The Formula for Calculating Keltner Channels
Remember, the indicator is composed of three lines (upper, middle, and lower), as such, the calculation will involve calculating the three to know exactly where the Keltner Channels would fall. Let's see it below.
We have the following to be;
EMA = Exponential Moving Average.
ATR = Average True Value.
Multiplier = 2.
Now;
Middle Line= The EMA over 20 periods (this is at default).
Upper Band= EMA + (2 * ATR).
Lower Band= EMA - (2 * ATR).
Note that: EMA is set at 20 periods while the ATR is at 10 periods with the multiplier being 2. The resulting calculation shows where the Channel lines (bands and the middle line) would be at a certain period. Although these are the settings at default, no rule ties you to using this, you can use any preferred settings as long as you are comfortable with it.
Some Trading Strategies with Keltner Channels
In this section of the lecture, we would be looking at a few things traders should watch out for when using this indicator. And some of those things are;
- Trend Confirmation.
- Dynamic Support and Resistance.
- Identifying Breakouts.
- Trading breakouts with Keltner Channels.
Trend Confirmation with Keltner Channels
There is something for everyone using this indicator for investment purposes even for the trend traders, as it enables traders to easily see the situation of things in the market under study and the trend can easily be seen through the Keltner Channels. Let's see some.
Uptrend
Uptrend confirmation with Keltner Channels is quite easy to identify, a few things to look out for is the angle of the channel and price movement of the asset around the channel. For an uptrend, the channel would have an angle facing the upward direction while the price of the asset moves between the upper band and the middle line (serving as support). This pattern of movement reveals that the asset is on an uptrend. Let's see an example below.
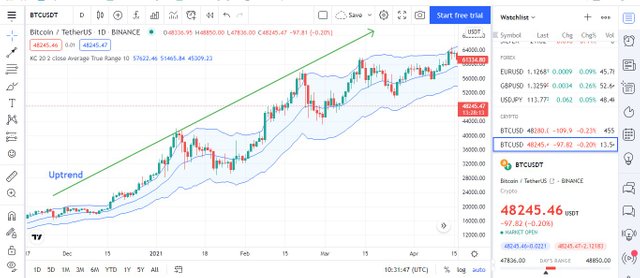
If you pay closer attention to the chart above, the channel is inclined upward while the price movement is between the upper band and the middle line. This implies a clear uptrend and trend traders can use a movement like this to make an entry into the market.
Downtrend
For downtrend as well, the angle of the channel plays an important role, likewise, the price movement of the asset within the channel. For a downtrend confirmation with Keltner Channels, the angle of movement of the channel would be inclined downward while the movement of the price of the asset is between the middle line (serving as resistance) and the lower band. Let's take a look at the chart below.
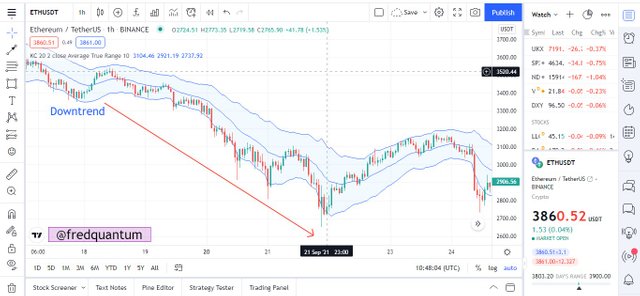
From the chart above shows the channel inclined downward while the price of the asset moves within the middle line and the lower band. This explains the theory behind the angle of the channel in a downtrend and what the price movement looks like within the channel.
Filtering Uptrend/Downtrend from Keltner Channels with 200 MA
As a trend trader using Keltner Channels to find an entry for your trades having identified an uptrend, to be sure of what you have seen, 200 Moving Average can save your day by filtering if truly a trend exists as indicated by the Keltner Channels. There are a few things to look out for when using 200 MA to filter the trend confirmation from Keltner Channels, let's take a look at them;
- For an uptrend, the Keltner Channels would be above the 200MA line.
- For a consolidating market, the 200MA line would be seen within the Keltner Channels.
- And for a downtrend, the Keltner Channels would be below the 200MA line. Let's take a few examples below.
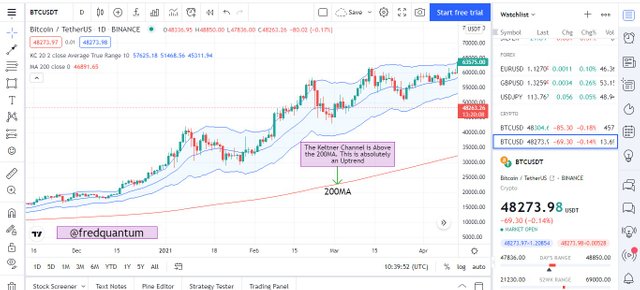
From the chart above, the Keltner Channel inclined upward and the price movement of the asset was seen to be within the upper band and the middle line, this is an indication of an uptrend. To filter how valid the uptrend is, we have used 200MA in combination and the Channel was seen to be above the 200MA, this makes the uptrend valid.
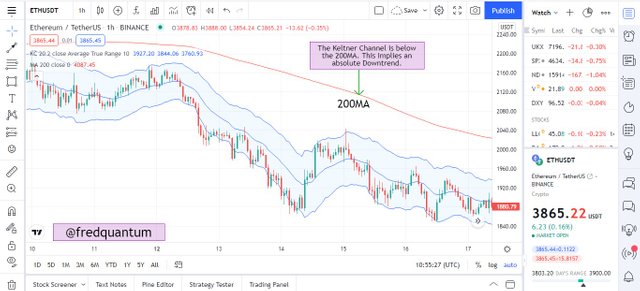
Likewise, in a downtrend situation above, the channel was inclined downward while the price of the asset moved within the middle line and lower band. Such a movement is associated with a downtrend, 200MA was combined with the Keltner Channels, the channel was seen below the 200MA which implies a valid downtrend.
Dynamic Support and Resistance
In contrary to the popular belief about support and resistance that they are seen on plain surfaces with perfect horizontal lines, support and resistance can be found diagonally and they are regarded as dynamic support and resistance and commonly filtered with the use of moving averages. Using the Keltner Channels, mostly in a ranging market, the upper band of the channel serves as the resistance line while the lower band serves as the support line. Let's take an example of this.
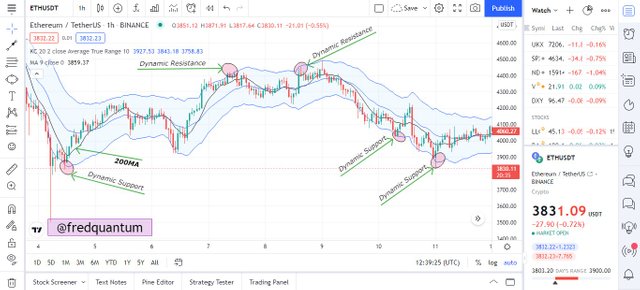
From the chart above, you can see the upper band acting as a dynamic resistance and the lower band acting as a dynamic support. This is simply how the channel acts as dynamic support and resistance if you look closely at the chart, some of the supports and resistances coexisted with previous ones.
Identifying Breakout with Keltner Channels
Breakout in a crypto market is simply when a price breaks above a resistance or below a support. Breakouts can be identified with this indicator after the price of the asset has moved in range for some time or reversed and moved towards a resistance/support and closes above/below it. Such a move is often associated with a valid breakout and prepare a trader ahead of the break entry.
In a bullish move, the upper band represents our dynamic resistance, when the bullish candlestick closes above the resistance line, this is an indication that it's likely the bull move continues. This could enable a trader to identify an early breakout and he/she can be prepared to make an entry when the opportunity opens. Similarly, in a downtrend move after a range movement or reversed trend, a close below the support (lower band) is an indication that the downtrend would continue. Let's take a look at the example below.
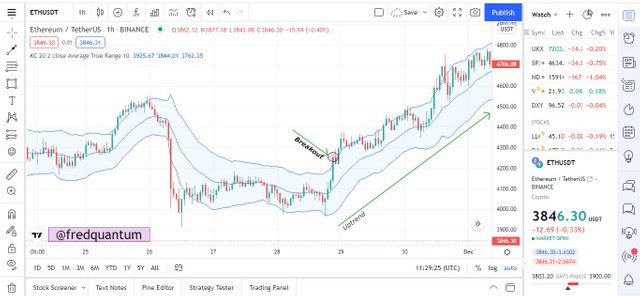
From the chart shown above, after a range movement, the price of the asset closes above the resistance line (upper band), it was resisted for a little while and the break happened again which sends the price of the asset uptrend. This is how a trader can utilize a breakout signal from Keltner Channels.
Trading breakouts with Keltner Channels
In the previous section, we have spoken about breakouts identification with Keltner Channel and in this section, we would be looking at how the breakouts can be traded to make some profit in a market. To trade breakout with Keltner channels, the EMA line would also serve as the dynamic support and resistance that determines my entry after a breakout. There are a few rules to be followed when trading the breakouts, let's see them below;
Rules for a Trading bullish breakout with Keltner Channels
- After a range or reversal price movement, wait for a break above the resistance line (upper band) as the price closes above it.
- Look for the price been resisted at that point while it changes direction (moves downward).
- If the price of the asset moves within the upper band and middle line for some time. And later supported at the middle line (EMA), make an entry after 2 or 3 candlesticks confirmation.
- Use proper trade management with your stop loss placed just below the support at the EMA line. See an example below.
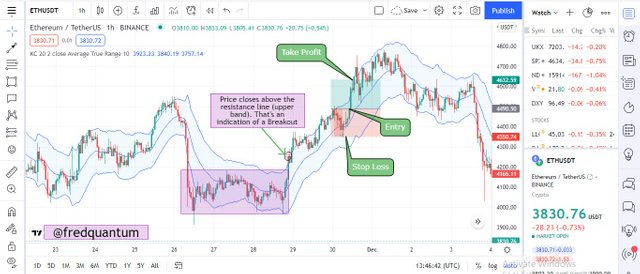
Buy trade setup (1:1) - Breakout with Keltner Channels
Rules for a Trading bearish breakout with Keltner Channels
- After a range or reversal price movement, wait for a break below the support line (lower band) as the price closes below it.
- Look for the price being supported at that point while it changes direction (moves upward).
- If the price of the asset moves within the lower band and middle line for some time. And later resisted at the middle line (EMA), make an entry after 2 or 3 candlesticks confirmation.
- Use proper trade management with your stop loss placed just above the resistance at the EMA line. See an example below.
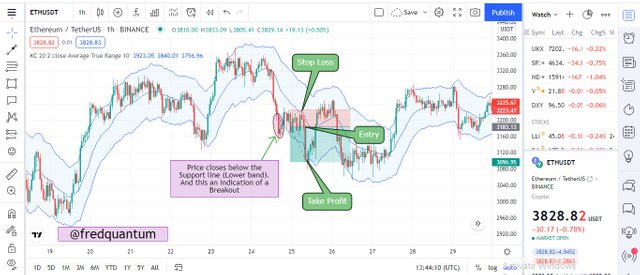
Sell trade setup (1:2) - Breakout with Keltner Channels
The Keltner Channels breakout trading rules require that you wait for a resistance/support at the breakout (after the price closes above/below) and another resistance/support at the middle line before making an entry. As such, you don't assume an Overbought/Oversold (which is often associated with a trend reversal) for a breakout. Kindly take note.
Conclusion
In conclusion, Keltner Channel is a great technical indicator that can be used to extract different signals, most of which we have discussed in this context. The output of the indicator solely depends on the settings of use adopted by the analyst and it's important you know that if the period of use is too low or high, the desired output might not be achieved, take note of that. The indicator works in some ways identical to Bollinger bands but has some distinctive differences between both. I hope you had a good read again. Thank you.
Homework Task
- Creatively discuss Keltner Channels in your own words.
- Setup Keltner Channels on a Crypto chart using any preferred charting platform. Explain its settings. (Screenshots required).
- How are Keltner Channels calculated? Give an illustrative example.
- What's your understanding of Trend confirmation with Keltner Channels in either trend? What does sideways market movement looks like on the Keltner Channels? What should one look out for when combining 200MA with Keltner Channel? Combine a 200MA or any other indicator of choice to validate the trend. (Separate screenshots required)
- What is Dynamic support and resistance? Show clear dynamic support and resistance with Keltner Channels on separate charts. (Screenshots required).
- What's your understanding of price breakouts in the Crypto ecosystem? Discuss breakouts with Keltner Channels towards different directions. (Screenshots required).
- What are the rules for trading breakouts with Keltner Channels? And show valid charts that work in line with the rules. (Screenshot required).
- Compare and Contrast Keltner Channels with Bollinger Bands. State distinctive differences.
- Place at least 4 trades (2 for sell position and 2 for buy position) using breakouts with Keltner Channels with proper trade management. Note: Use a Demo account for the purpose and it must be recent trade. (Screenshots required).
- What are the advantages and disadvantages of Keltner Channels?
Rules and Guidelines
#fredquantum-s5week6 #cryptoacademy #club75 #keltner-channels #steemexclusive #technical-indicators #clubdolphin #club5050
Very informative lecture on the keltner channels indicator.
Thanks, bro.
Very detailed lecture on Keltner Channel professor.
Professor kindly check whether I am eligible to participate in beginner course or not.
Yes, you are qualified to participate in the beginners' class. According to the #club5050 criterion, you are eligible, you have transferred out 20 STEEM and have powered up 242 STEEM within the last one month. That makes you eligible. Thank you.
Hi, @fredquantum,
Thank you for your contribution to the Steem ecosystem.
Please consider voting for our witness, setting us as a proxy,
or delegate to @ecosynthesizer to earn 100% of the curation rewards!
3000SP | 4000SP | 5000SP | 10000SP | 100000SP