Crypto Academy Week 16 | Homework Post for @fendit | The Wyckoff Method
Introduction
I'm glad to be here again for learning at the academy, I've attended some lectures earlier which are wonderfully presented by seasoned professors. This time, I read the lecture presented by professor @fendit where the professor talked about the topic The Wyckoff Method and I will be solving the homework given by the professor.
Introduction to Wyckoff method
Wyckoff method is a technical analysis tool used for analyzing the price behavior of an asset over time in the quest to help traders/investors to prepare themselves for different positions (long/short) in a crypto market, the method that was invented by Richard Demille Wyckoff. Wyckoff method on a technical chart analysis in cryptocurrency is a preparatory stage whereby the analyst opens a chart study to prepare themselves for the next move in a crypto asset market of choice.
The Wyckoff method in chart analysis detects the price behaviour of an asset to have 4 different cycles which are 1. Accumulation- which is associated with 2. Market up/Uptrend (Mark up) and 3. Distribution- which is associated with 4. Market down/Downtrend (Mark down). The method entails three fundamental laws which would be discussed as I proceed in this context.

1. Share your understanding on "Composite Man" and the fundamental laws. What's your point of view on them?
Composite Man
Composite Man is well recognized in the Wyckoff method and what this means in a crypto market is to visualize it as being controlled by a single person/body rather than a large number of traders/investors to predict the next move of an asset. A composite man stands for a single entity acquiring assets in the crypto market to get others involved in the process of purchase to see the price of the asset go uptrend, which would come with profits as he/she has acquired the assets when the price was still low.
The concept of Composite man is to act as an investor that accumulates an asset and gets others involved in the market to predict what the next the price behavior of the asset would be and use that analysis to take profit in a crypto market. This is often done by detecting the trend in the crypto market and imaginarily creating a picture of what the move would be by involving other traders/investors and as such, set profit levels for the investment. Going further, the Composite man performs 4 phases that make up a cycle which is Accumulation, Mark up (Uptrend), Distribution, and Markdown (Downtrend). Let's take these four phases one after the other.
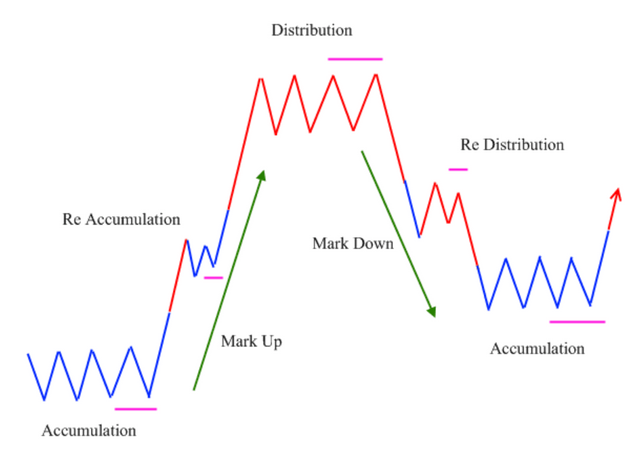
1. Accumulation
This is first phase of the cycle whereby the Composite Man starts accumulating crypto assets in a market and at a very low price. At this stage, the Composite man gets others involved in the purchase of the asset to predict the next move of the asset. This would have an impact on the price behavior of the asset and the Composite man can easily set profit levels based on predictions.
2. Uptrend (Mark Up)
After the activity of the Composite man in the first phase, getting others to be involved in the crypto market increases the value of the asset since there has been a high demand for the asset. The price behavior of the asset goes uptrend/bullish, a point where the asset rises in value due to the activity of huge purchase and at this stage, the assets kept by the Composite man would have greatly increased in value as compared to the initial purchase value.
3. Distribution
This is the third phase in the cycle of Composite man whereby the accumulated assets that have greatly increased in value are sold off by the Composite man to take profits from the crypto market. At this point, it is the point of taking profit as predicted by the Composite man, the accumulated assets that have enjoyed a massive value rise as predicted by the Composite man is sold to fulfill the aim of entering the market.
4. Downtrend (Mark Down)
Heavy sell in a crypto market brings down the value of an asset and this is exactly what happens at this phase of the Composite man's cycle, the distribution phase brings the supply to exceed demand because users are selling off their assets and as such, the value of the crypto asset is brought down leading to a downtrend/bearish of the price behavior of the asset in question.
My thought on Composite Man
The Composite man is a great component of the Wyckoff method which if practiced well brings massive yields for the investor/trader as he/she stands to be a market mover with involving other investors to make a purchase and as such, put his/her take profit level in place according to the prediction made. The cycle of the Composite man can also start from a bearish market, when the Composite man sells off assets massively involving others to sell theirs, the price goes downtrend and the Composite man waits for the perfect time to re-buy (accumulate) to start the cycle over again in the quest to see the asset go uptrend again.
Three Fundamental Laws- The Wyckoff Method
1. The Law of Supply and Demand
As demand and supply is a great determinant in other stock market and cryptocurrency market so as well it is in the Wyckoff Method such that when an asset experiences high demand, this results in value push which has the market price of the asset go uptrend, in other words, it goes bullish. So as well, when the supply exceeds demand in a cryptocurrency asset market then the asset goes down in value which makes it experience a downtrend, in other words, it goes bearish.
In short, when the demand of an asset is higher then the price of the asset goes uptrend and when the supply of a crypto market is higher than the demand then the market goes downtrend. In the Wyckoff method, this is estimated on the chart pattern of the asset by determining the trend (uptrend/downtrend) and check for the volumes and price bars/lines to study the price behavior of the asset over a particular period.
My thought on the Law of Supply and Demand
The law of Supply and Demand in the Wyckoff method is very efficient as investors can easily analyze what has happened in the price behavior of an asset over time to see how Demand and Supply have affected the market. Demand and Supply is a great determinant of the rise and fall of an asset, which I've always used to predict the next price behavior of the asset by estimating the volume of buy/sell order placed before making a decision. Likewise, in Wyckoff method, with no doubt, it's effective as it aids in checking on volumes and prices on the asset's chart to make a decision
2. The Law of Cause and Effect
In a cryptocurrency market, the price behaviour of an asset over time whether Uptrend or Downtrend is as a result of actions that has taken place in a preparatory stage. The Wycoff method identifies the preparation stages as the cause of whatever happens in a crypto market and the results of the preparation stage to be the effect.
The Causes in this context are Accumulation and Distribution where; The cause accumulation is characterized with market uptrend where the price of the asset rises, in this case, Uptrend is the effect of the cause "Accumulation" and the cause Distribution is characterized with market downtrend whereby the price of the asset falls and in this case, Downtrend is the effect of the cause "Distribution".
My thought on the Law of Cause and Effect
Wyckoff method's law of cause and effect is with no doubt a valid law knowing well that price behaviour of an asset must have been triggered by some set of activities. An event in a crypto market is triggered by an action and as shown in Wyckoff method, Accumulation triggers the Uptrend movement while Distribution triggers the Downtrend. This law in Wyckoff method satisfies both theoretically and practically.
3. The Law of Effort and Result
Another interesting law in the Wyckoff method is the law of Effort and Result which establishes a relationship between Volume and price of an asset such that, if the price of the crypto asset work hand in hand with the volume of the asset, then it is evident that the current trend of the asset continues but if there is a difference between the price and volume of the asset, then one can be expecting a trend reversal (bearish<--->bullish / bullish<--->bearish).
Highlights of the Law of Effort and Result
For instance, in an extremely Ethereum bearish market, if in the process triggers a high volume then that is Big effort with characteristics reduced bearish, the reduced bearish can be termed Small result until there is a significant change between the volume and price of the asset to cause a trend reversal, then we have a big result accompanying the high volume's big effort.
Note that
- High Volume implies- Big effort.
- Early stage of High Volume in an extremely bearish market implies- Big effort with characteristics Small result until there is a clear trend reversal to yield Big Result.
- Low volume implies- Small effort.
My thought on the Law of Effort and Result
With the laws involved in the Wyckoff method been potent such that they are theoretically and practically proven, the Law of Effort and Result is not an exception. High volume is the good implication that investors have gathered some momentum to acquire more assets that give yield to Big effort and in the long run, turns out to be Big result, and low volume is characterized with users having relaxed in a market which yields Low effort which in the long run gives Small result unless there is a change in the market activity.
2. Share a chart of any cryptocurrency of your choice (BTC or ETH won't be taken into account for this work) and analyze it by applying this method. Show clearly the different phases, how the volume changes and give detail of what you're seeing.
For this section of the task, I will be analysing ADA/USDT (Cardano/Tether) market using the Wyckoff Method on a 4-hour time-frame chart pattern of the asset on TradingView. Let's take a look at what I found below.
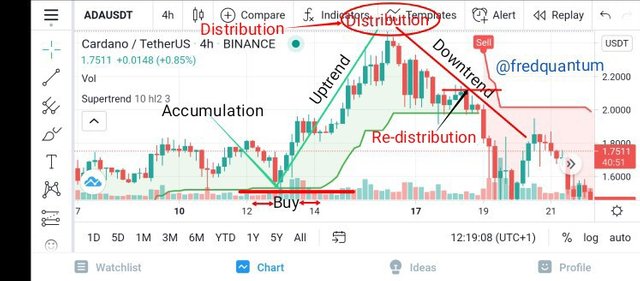
Wyckoff method- ADA/USDT
From the chart pattern analysis above using the Wyckoff Method, I also used my SuperTrend technical indicator which easily gives signal for a buy/sell position.Using the Wyckoff method, I've marked out several phases on the chart pattern; Accumulation, Uptrend, Distribution and Downtrend. Let's see my observations below.
Accumulation: The ADA/USDT market was on a bearish trend before hitting a support line opening a good buy position. We can say at this point, the Composite man entered the market and gets others to be involved in the purchase of the asset. Interestingly, at the point where the accumulation began causing a trend reversal (Uptrend) was exactly where the Supertrend indicator gave a buy signal, thereby, strengthening the accumulation. Let's proceed to the next phase.
Uptrend (Mark Up): There was a huge purchase at the accumulation area which increased the volume of the asset with big effort such that the value of the asset increased and the asset's market goes Uptrend. On its way up, there was a slight resistance which could be as a result of assets sold by some holders, the resistance was so little with no major trend reversal and the asset goes uptrend still.
Distribution: Now, we reached a point whereby the volume is still very high but value drops as many holders starts selling off their ADA assets. This is a point whereby users who possibly acquired the asset at a lower price starts selling it off to make some profits from the market which fulfils the phase of Distribution.
Downtrend (Mark Down): After distribution, which is a phase where holders of ADA asset heavily sold off their assets, the price of ADA starts going downtrend massively, at a point, a support surfaced and the Supertrend indicator also showed the support for purchase, a few traders entered and this caused a redistribution which broke the Supertrend indicator's support and has the trend continued in the bearish trend.
Conclusion
In conclusion, the Wyckoff Method is not just theoretically proven but effective practically and it's a great technical tool to study the price behaviour of an asset over time to make a prediction for the next move in preparation to get some profits from the market. Thanks to professor @fendit for presenting an awesome lecture like this. Thank you, all.
Written by;
@fredquantum
Thank you for being part of my lecture and completing the task!
My comments:
Your answers were really good, but the chart wasn't that ok. Accumulation and distribution were not properly shown.
Overall score:
6/10