Crypto Academy / Season 3 / Week 7 - Homework Post for @yousafharoonkhan | How to create an account on TradingView, how to use indicators, tools, features of tradingview
Introduction
It's another great time to learn again at the academy in week 7 of season 3. It's been a great journey of learning and this time, I've attended the lecture presented by professor @yousafharoonkhan which is centered on TradingView and of course, it's a great lecture to attend. I will be attending to the task given by the professor.
Designed in Canva using a free image- Image Source
1. What is the TradingView?
TradingView is an invention of Stan Bokov, Denis Globa, and Constantin Ivanov which came into existence in the year 2011. It is a platform that provides different market data for stocks, forex, cryptocurrency, and so on, which keep traders informed about the latest market data as desired to know. TradingView is with no doubt one of the best platforms for easy access to the market's live data, charting, analysis tools to take advantage of the available opportunities in the market.
Speaking of cryptocurrency, the TradingView platform provides live data for numerous cryptocurrencies, the charts that show the price behaviors of the assets over time, analysis tools that enable users to perform technical analysis on assets in the quest to take advantage of the available benefits in an asset's market.
In addition, TradingView hosts a space where experts and investors can come together to share ideas and anyone can take advantage of the ideas to improve their operation in the space. So much more about TradingView, it's generally a platform that brings us closer to different assets and enables us to benefit from the market by exploring different features of the platform.
How to Register on TradingView
I will giving the processes that is involved in registering on the TradingView platform. Let's see the steps below.
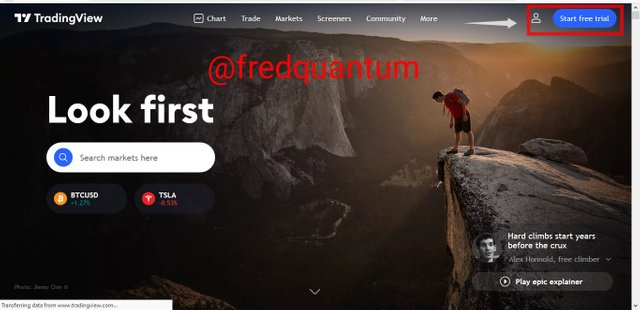
Start a free trial
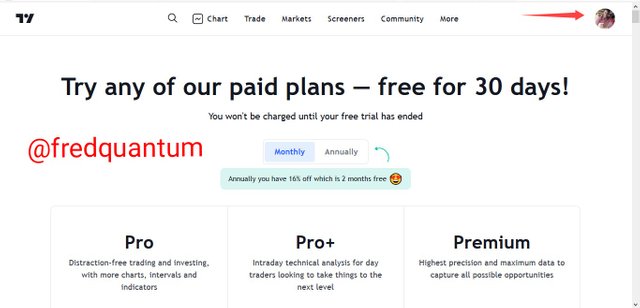
Try free basic
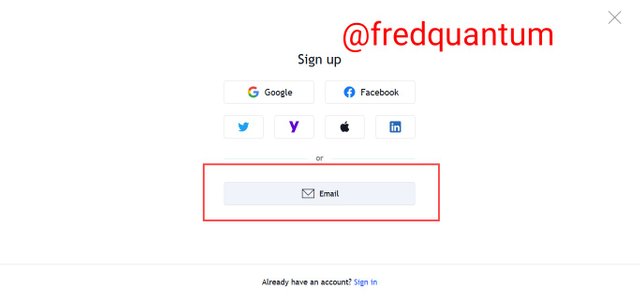
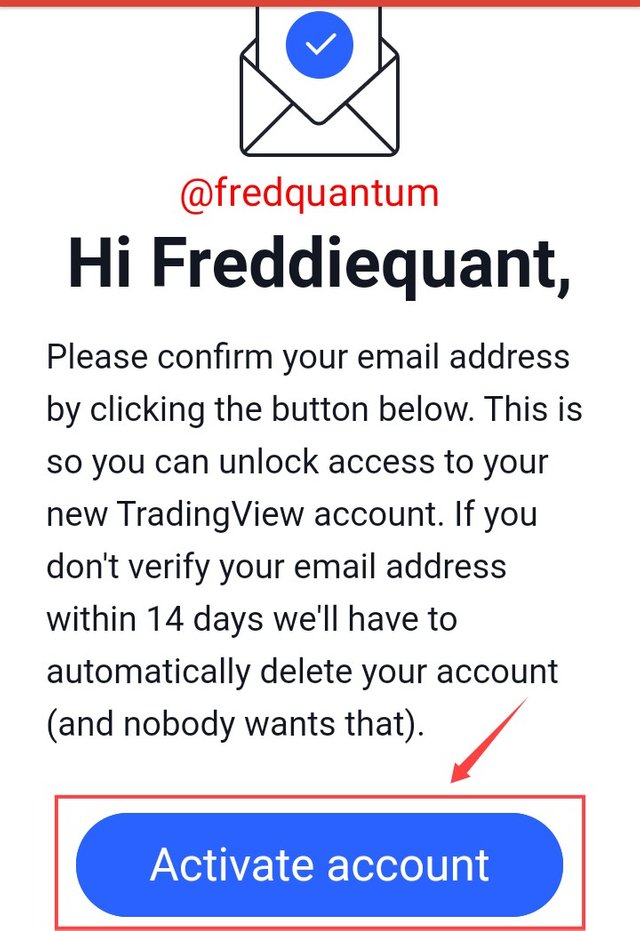
Selected Email
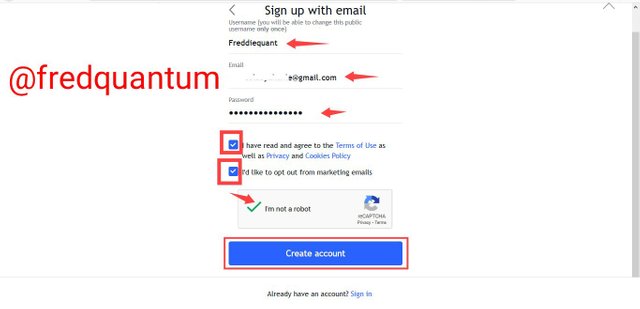
Supplied details and Create account
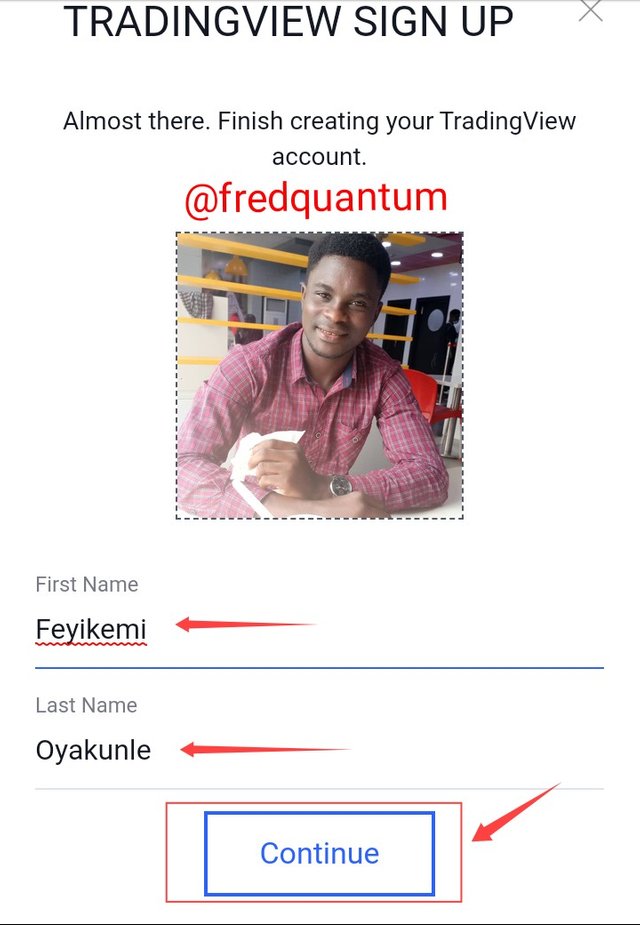
My TradingView account is ready
Different Registration plans available on TradingView
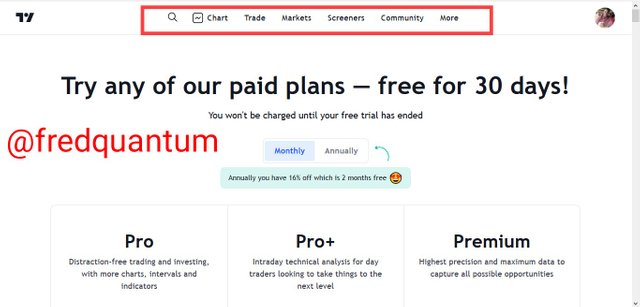
There are four different registration plans on TradingView, namely; Free Basic, Pro, Pro+, and Premium.Let's take a look at each of them below.
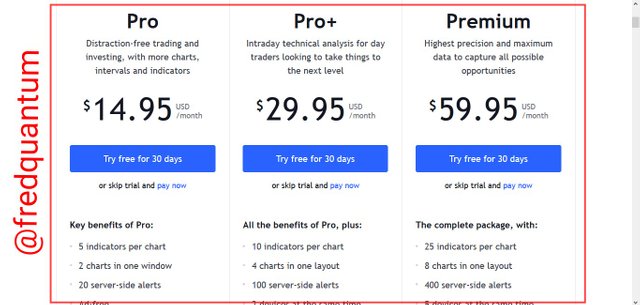
TradingView registration plans
Free Basic account plan
Free Basic registration is the lowest plan of the registration plans available on TradingView. It comes with free registration and is opened to everyone so far you are registering with a valid email address. One thing to note about the free basic is that users are restricted in the use of certain features of the platform, for example, the numbers of indicators that can be added to the chart using a free basic account are limited to just 3 indicators per chart. The free basic account can be upgraded to another plan if one can pay for it.
Pro account plan
At the beginning of the registration one can choose this plan or upgrade to it. Unlike the free basic account plan, this comes with a cost of 14.95 USD per month and it comes with extra benefits which are not available in the free basic plan. Some of the benefits are; users can add up to 5 indicators on a chart, having 2 charts in a window, 20 server-side alerts, no ads disturbance, volume profile list, multiple enhanced watchlists and many more. In short, some of the benefits that are missing in the basic free account are unlocked in a Pro account plan.
Pro+ account plan
Pro+ is one of the registration plans which comes with higher benefits as compared to free basic and Pro accounts. The Pro+ account plan comes with a cost of 29.95 USD per month and some of the benefits that are unlocked in this plan are; users can add up to 10 indicators on a chart, 4 charts can be added in one layout to keep a track of different trades, 100 server-side alerts, traders can use 2 devices at a time, intraday exotic charts and many other. This plan can be chosen at the point of registration and one can be upgraded to it to benefit from the plan features.
Premium account plan
This is the highest registration plan available on TradingView at the moment and comes with a lot of benefits that supersede the earlier mentioned plans. The cost of registering is 59.95 USD per month and one can choose it at the beginning of the registration or upgrade to it later. Some of the benefits of Premium plan are; users can add up to 25 indicators per chart, 8 charts in a single layout, 400 server-side alerts, a user can use 5 devices at a time, up to 20,000 bars of data on the charts and so on.

2. Different features of TradingView
The features of the TradingView are numerous and we can see the main features to be; Chart, Trade, Markets, Screeners, Community and More but there are many other sub-features that would be discussed as I progress in this section of the task. Let's each of the features one after the other.
TradingView features
Chart
This is one of the features of TradingView which is useful for technical analysts to keep track of any asset of choice. A chart is a useful tool for technical analysis tools that enable traders to see the price behavior of an asset over time having the price represented in bars, lines, candlesticks, and so on. Different support and resistance in the market are seen on the chart and traders can take advantage of them for analysis, in addition to indicators, users to detect certain movements in an asset's market to decide entry or exit. Let's see the TradingView chart below.
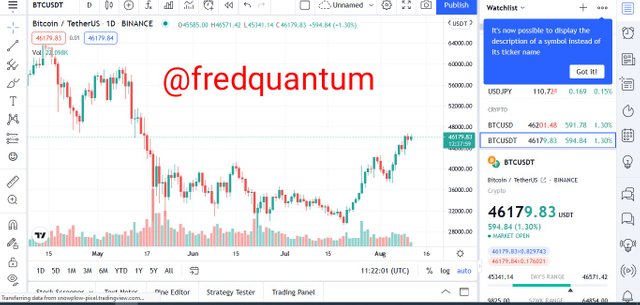
TradingView chart
Trade
Trade
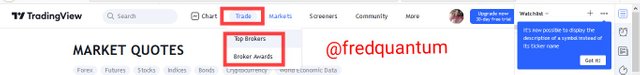
The TradingView platform also allow traders to trade through the platform. As such, trading with a broker is possible on TradingView as orders can be placed directly through the platform and hasten effective trading when done with analysis on the TradingView. The trade section has two sub-features which are Top Brokers and Broker Awards. The top broker's section shows the available broker on the TradingView that enable traders to submit orders directly from the platform and some of the top brokers are; Capital.com, Currency.com, FXCM and many others. See the screenshot below.
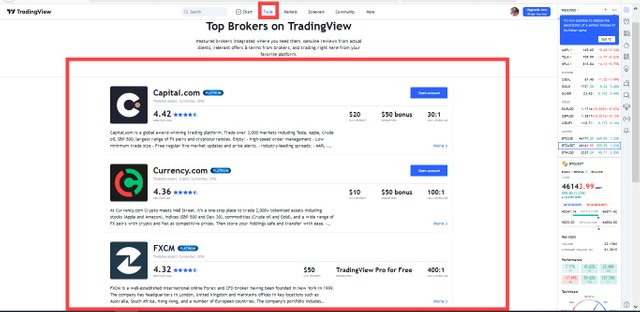
Top brokers on TradingView
Markets
Markets feature of the TradingView gives the overview of the market data of assets available based on the category they fall into. This section consists of several Sub-features of financial markets which are; Cryptocurrencies, Currencies, Stocks, Indices, Futures, Bonds, and Sparks and each of these have sub-categories. The assets live data are available on the platform are group based on the aforementioned sub-features. Let's see the screenshot below
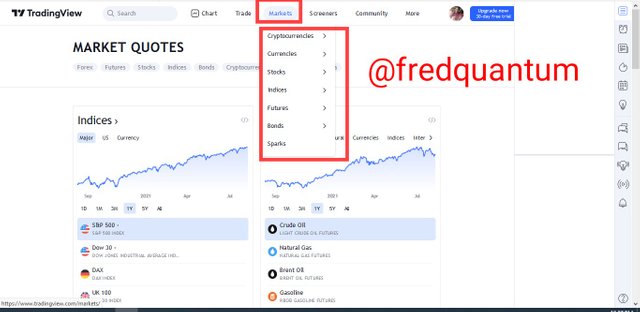
Markets
Screeners
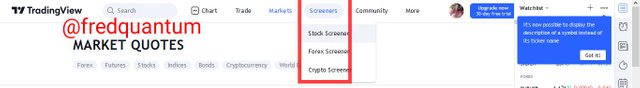
Screeners
Screeners is another feature of the TradingView platform where traders can see different assets and screen them to one's preference. The sub-features of screeners are; Stock screener, Forex screener, and Crypto screener. Let's take the example below.
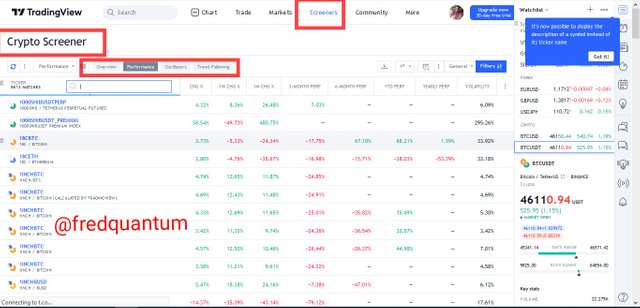
Crypto screener
Above is the crypto screener page and we have four categories that enhances screening of information as required by a user and they are, Overview, Performance, Oscillators and Trend-following. The information of the assets can be easily screened depending on the interest of the user.
Community
This is another important feature of the TradingView platform as users can get several trending information that can be useful to gain an insight into a particular market. Here, users can follow different users and get timely information through their publications to stay on track with trending news in the market. This feature has four major sub-features, which are; Ideas, Scripts, Streams and More.
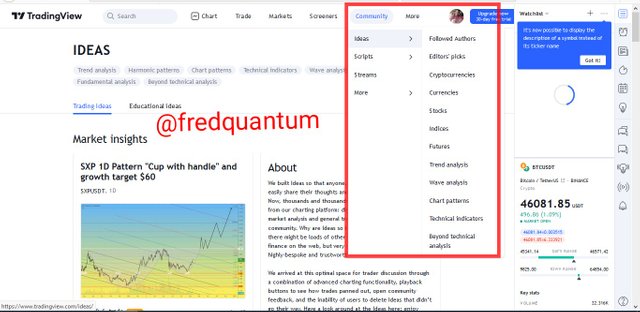
Community- Idea
Importantly, this feature can be used for fundamental analysis as information gotten from the community can be used to gain insight into the market of an asset.
Watchlist
TradingView also gives room for users to keep assets under the watchlist and we can categorize this under more features, such that they keep can track of different assets maybe for investment or other purposes. Let's see the watchlist interface below.
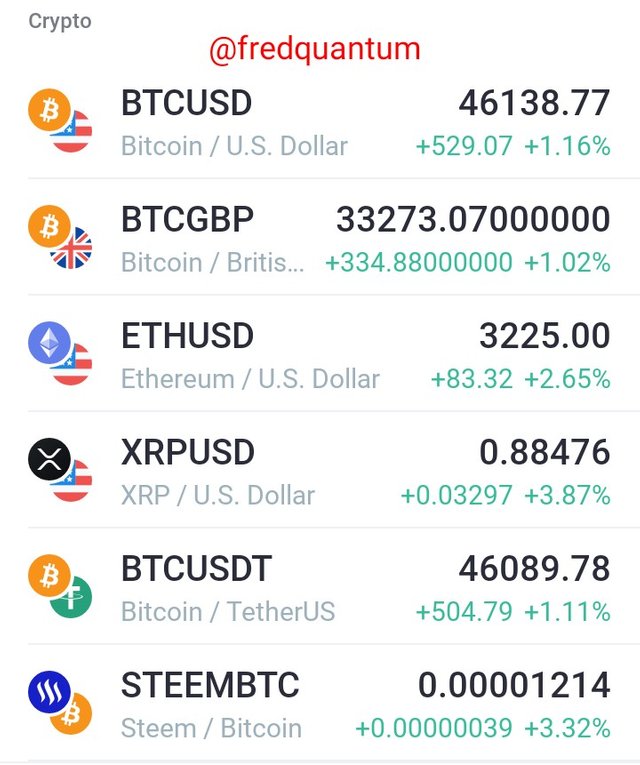
Crypto watchlist
Above is my crypto assets watchlist which I added on the TradingView platform.
My favourite feature of the TradingView
My favorite feature amongst all the available features on TradingView is the Chart which enables one to keep track of the price movement of an asset over time as represented on the chart pattern and used to perform technical analysis in addition to fundamental analysis that can be carried out with other features of the TradingView. It is my most used and favorite tool on the TradingView platform. Let's see the chart below.
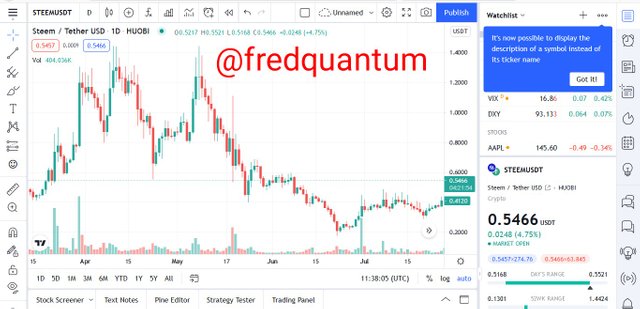
STEEM/USDT pair
Above is the chart of STEEM/USDT asset at a 1-day timeframe and the price behavior of the asset over time is represented with the candlesticks which make up the chart pattern.
Why Chart is my Favourite feature
The reason for having a chart as my favorite feature is the fact that I am a crypto trader and I use the combination of fundamental and technical analyses before I enter a market. I do more technical analysis before I make an entry into a market and this is only achievable through accessing the chart where I can identify different support and resistance and even combine indicators to carry out my technical analysis to stay safe in trades, as such the chart remains my favorite feature of the TradingView.
3. How to set up a chart in TradingView and use 2 tools to edit it
It's important to know how to set up the chart on TradingView and exploring different settings of the chart as it can be configured to preference. Let's see a few steps on how to navigate to the chart.
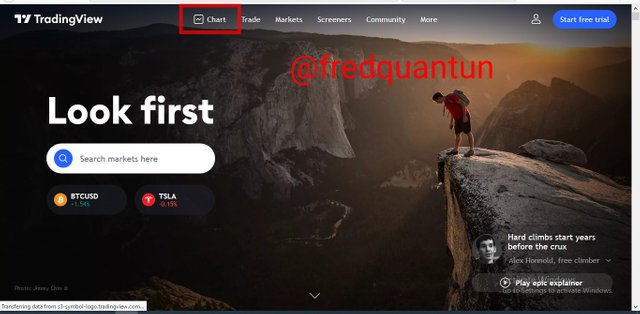
Selected chart
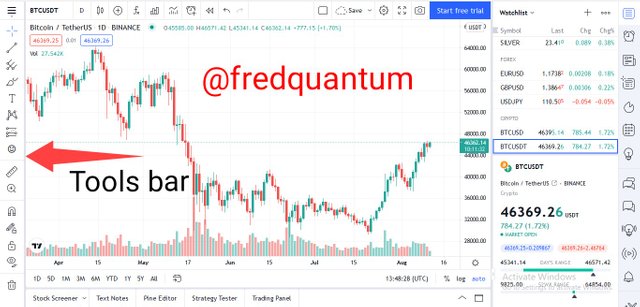 Chart- Tool bar
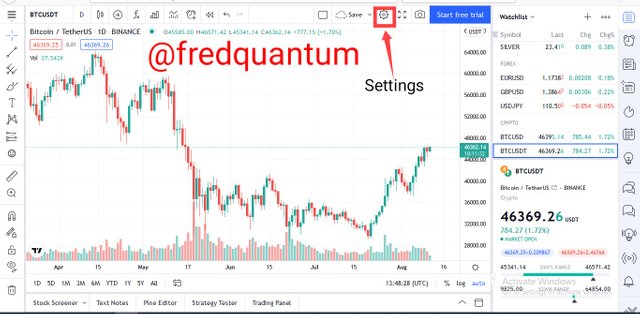
Settings
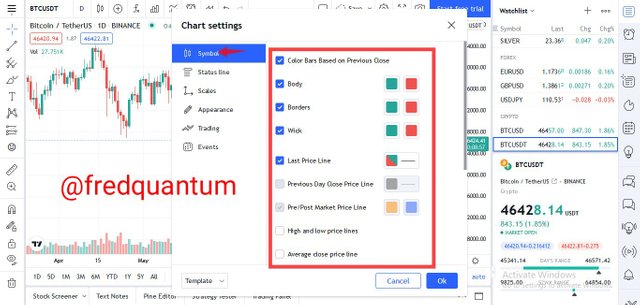
i. Symbol
Symbol is the first on the chart settings and it has the settings like Color bars based on the previous close, body, borders, wick, last price like, and so on. In this section, we can configure the colors of the candlesticks for both bullish and bearish, even for its body and border. We can also choose to add or remove the wicks from the component of the candlestick and so on. In this, I keep the color for my bullish and bearish candlesticks to be green and red respectively.
Symbols
ii. Status line
The status line is another setting under the chart which has the likes of, shows open market status, OHLC values, Bar changes values, Show buy/sell buttons, and so on. One can choose to hide/show any of the aforementioned settings by simply ticking the box and effect it by clicking the OK button.
Status line
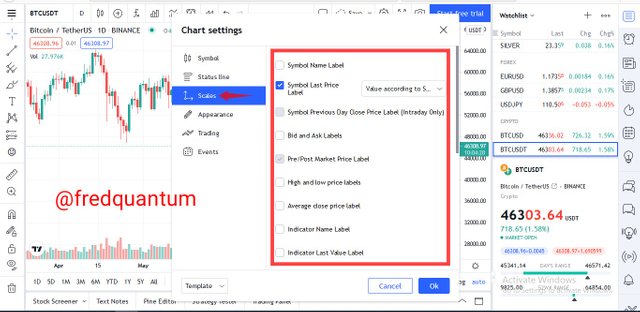
iii. Scales
With the scales settings, we can choose to enable some labels on the scale of the chart and we can choose to hide them by simply ticking the box. Some of the options under this section are; Symbol last price label, bid and ask labels, high and low price labels, and so on.
Scales
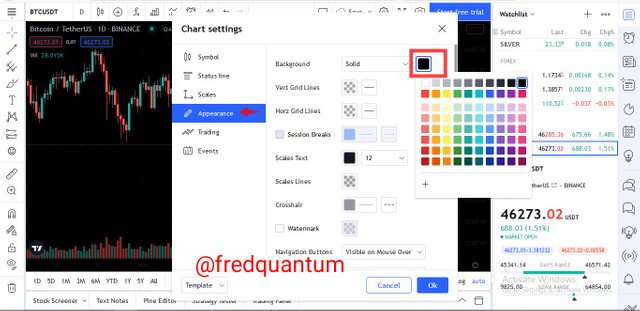
iv. Appearance
Appearance is also one of the settings of the chart and here we are dealing with certain appearances on the chart, for example, we have; Background format and color, Vertical grid lines and Horizontal gridlines format, Scales text size and color, and many more. Let's see how I changed the background to solid black below.
Background- Solid black
v. Trading
This part of settings deals with trading and we can enable the options we want to or the ones we wish to hide and some of the options we have here; Show positions, show orders, extend lines left and so on. Each of the options can be changed to preference by just ticking the boxes and effect it by clicking the OK button.
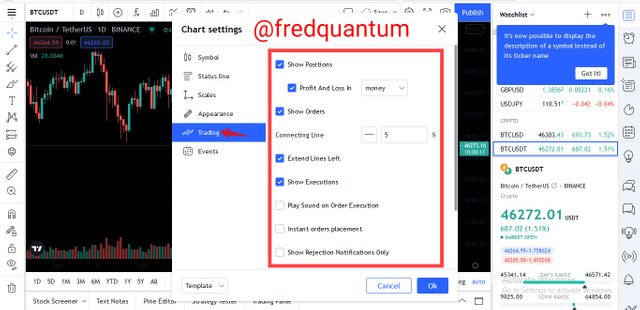
Trading
We have successfully explored the chart settings and one of the things to look into is the configuration on the chart, like; changing to an asset of choice, change the timeframe, the chart pattern representation (lines, bars, candlesticks and so on) and many more. Let's some of them below.
Change Asset on the Chart
By clicking on the pair of the asset currently on the chart, we can easily search for another pair of choices and activate it, for example, I searched for STEEM/BTC and activated it on the chart. See the screenshots below.
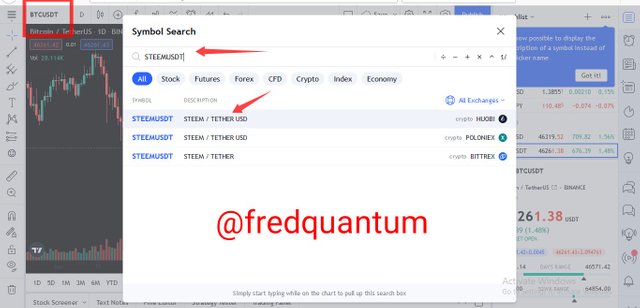
Searched for STEEM/USDT
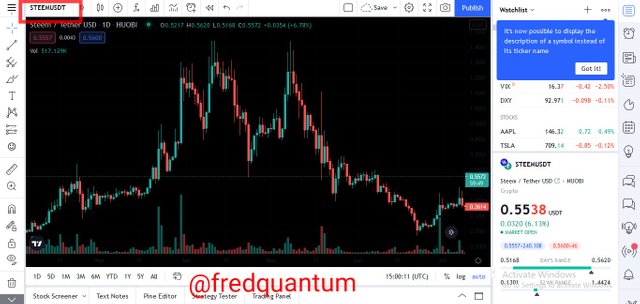
Chart changed to STEEM/USDT
Timeframe
It is important to change the timeframe on the chart to the one that best suits our trading style, and one can choose from the list; 1secs, 1mins, 5mins, 1hr, 1day, 1week and many other available.
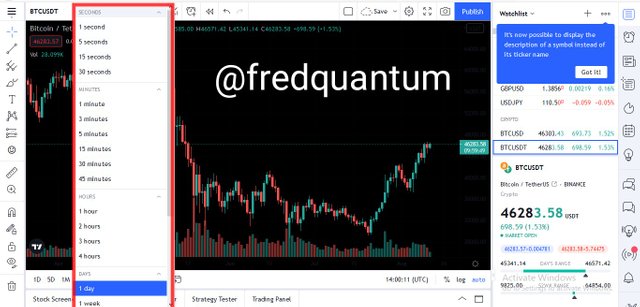
Timeframe selection
Charts type
We can choose how we want our chart pattern should be represented from the list; Bars, lines, candlesticks, area, hollow candles, and so on.
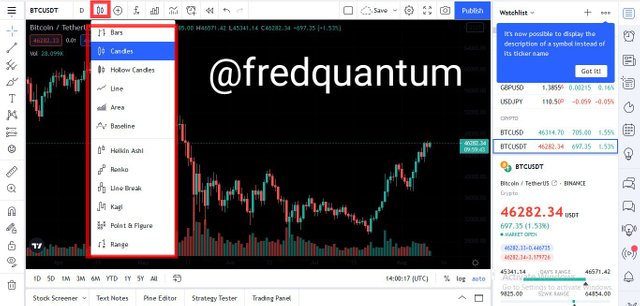
Charts type
How to use Two tools to edit the Chart
In this section, I will be using two different tools to edit the chart. The tools I will be using are Trend line and Long position. Let's each of them below.
1. Trend line: The trend line is used to drawn lines in the direction of a trend, either to higher support and resistance or shows the pattern formed on a chart. I will be picking the trend line tools from the chart below and use them to edit the chart.
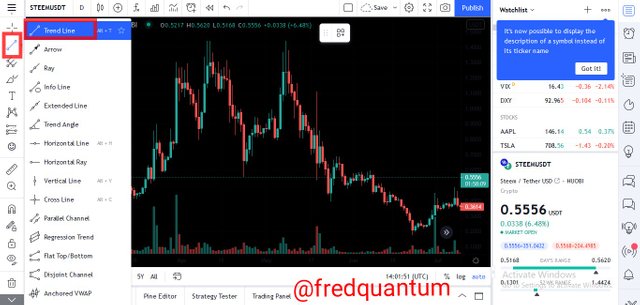
Picking the trend line
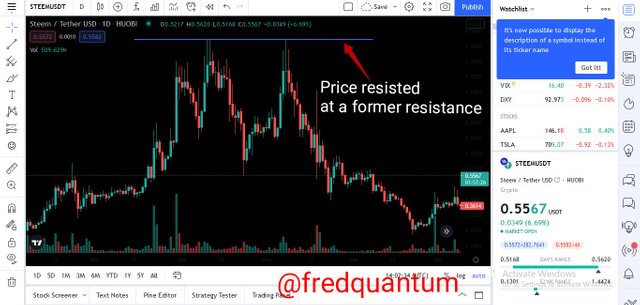
Trend line at resistance level
From the last chart above, I used the trend line to draw a line at a resistance level when the price of an asset was resisted at the former resistance. The trend line can be drawn horizontally, vertically, and diagonally depending on the direction where an analyst wishes to analyze.
2. Long Position: The second tool I will be considered in this section is the Long position tool, this tool is associated with a trade-in a buy direction and it is used to estimate the ratio of risk to reward in a trade setup to properly set take profit and stop loss. The opposite of this tool is the Short position which is associated with the sell trades. Let's pick the tool below.
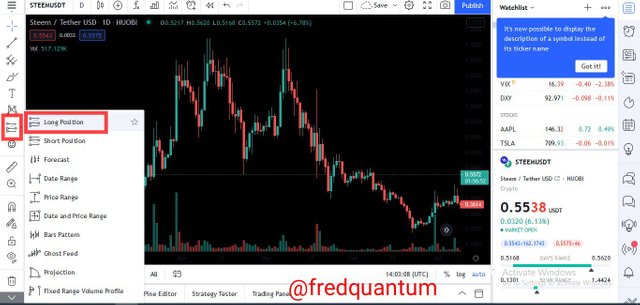
Picked the Long position tool
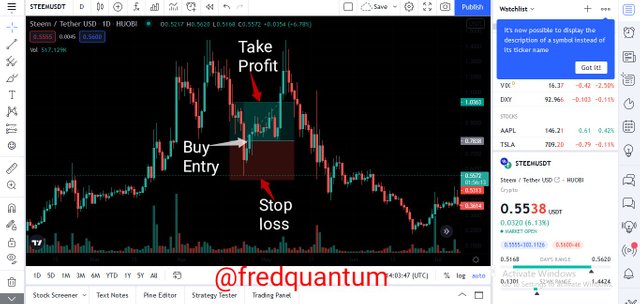
Long position- Take profit and Stop loss
From the last chart above, I have used the long position tool to draw my take profit and stop loss levels at a 1:1 RR (Risk to Reward ratio). Provided I entered the trade at the Bullish candlestick that appeared after consecutive bearish candlesticks, I used the long position tool to draw my take profit and stop loss levels at an equal exposure to profit and loss, this would minimize my loss should in case, the setup goes wrong.
4. How to add an indicator on the chart and my favourite indicator
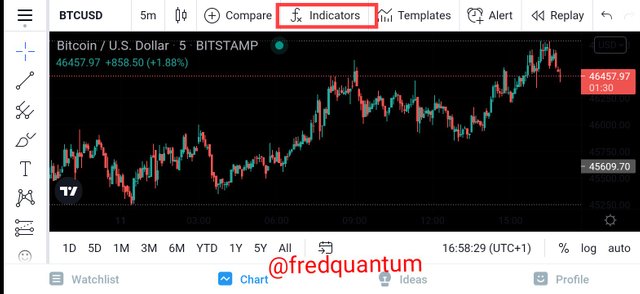
Select fx
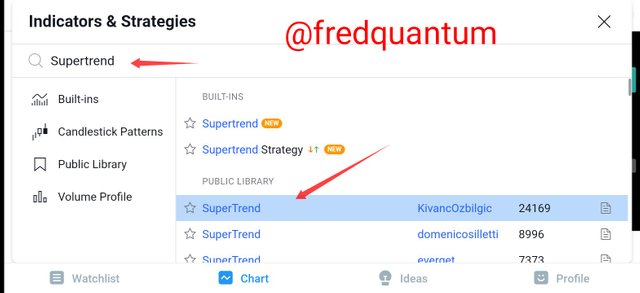
Clicked the Supertrend indicator
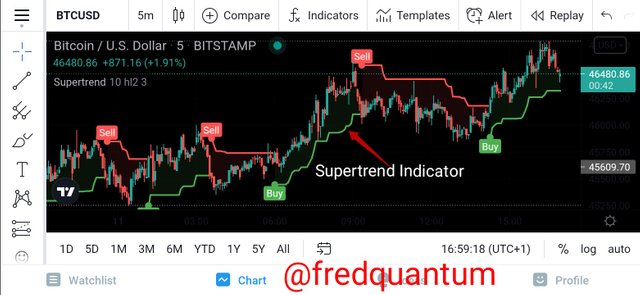
Supertrend indicator on the chart
Supertrend indicator settings
I am interested in altering the settings of my indicator such that I clicked on settings on the indicator.
Settings
The default period of the Supertrend indicator is 10 and 3 under inputs, having the ATR Period to be 10 and the ATR Multiplier to be 3. I changed the ATR period to be 14, this is how I love using the indicator.
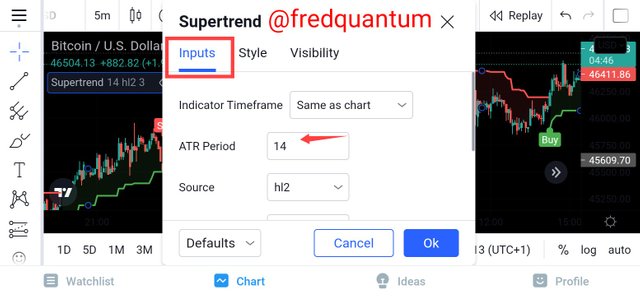
Period- 14
I navigated Style and kept the settings at default having the colour for uptrend line to remain green and downtrend line remain red.
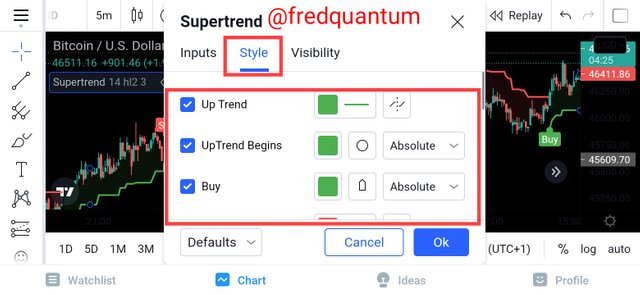
Style
Now to visibility and I kept it at default. I clicked the OK button.
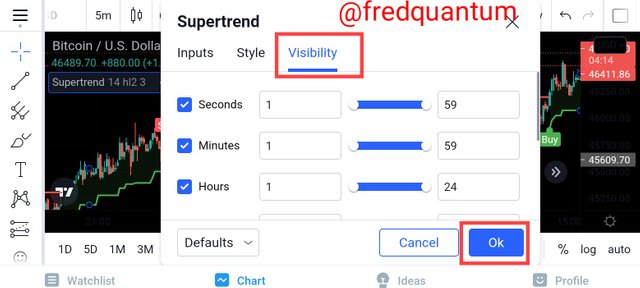
Visibility
The Supertrend indicator is fully set on the chart at the 14 period.
Supertrend indicator
My Favourite Indicator- Supertrend
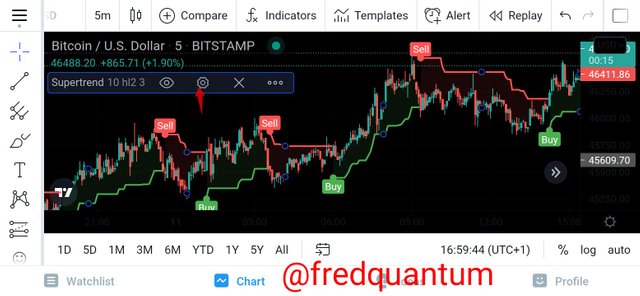
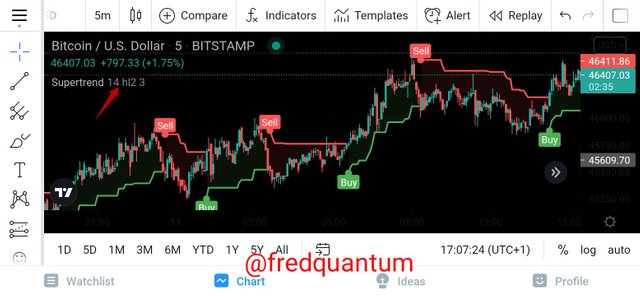
My favourite indicator is the Supertrend indicator and it's the one added above. What to know about the Supertrend indicator? Supertrend indicator is one of the trends following indicators which operates in a few similar ways to the moving averages and MACD indicators that move with the trend of an asset. In the case of the Supertrend indicator, it's plotted on the price of an asset in the current trend and gives Buy and Sell signals.
Why I chose Supertrend as my favourite indicator? The Supertrend indicator eliminates the stress of finding support and resistance by an analyst as it automatically finds each level and plots the line. In addition, it supplies the buy and sells signals which are quite accurate. This feature makes me love this indicator so much, I have used this indicator numerous times and it's accurate for trading. Know that no indicator is accurate 100% as such, Supertrend indicator also gives false signals and one should take note of such occurrence to stay safe in trades. Let's see some examples.
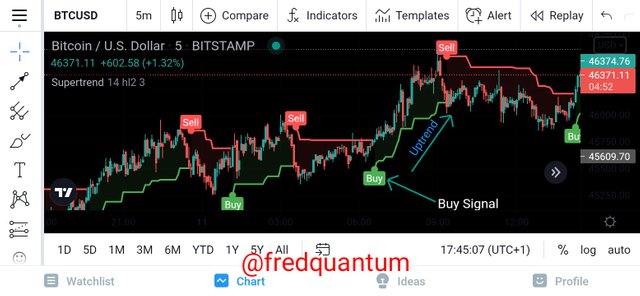
Buy signal
From the chart above, at a point where the Supertrend indicator gave a buy signal, the market goes uptrend and a trader would take advantage of that to make some profits from the market.
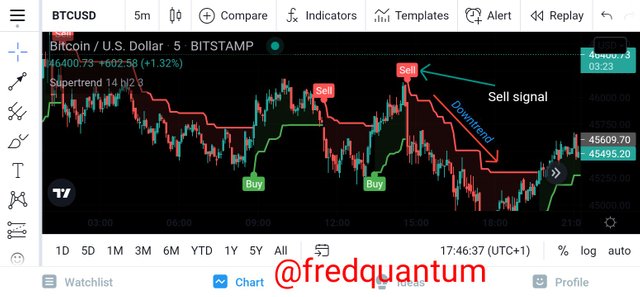
Sell signal
Also from the chart above, the Supertrend indicator gave a sell signal then the asset moved downtrend which makes the signal a valid one. That is how the Supertrend indicator works but users should also be careful when using this indicator as it can give false signals sometimes, it can be used in combination with other indicators to confirm the signal.
5. Do you think TradingView is useful in predicting the market for cryptocurrency (trend / price)?
One of the first things to understand is that the TradingView platform enables one to carry out fundamental analysis by following the community ideas, following the data of an asset over time, and so on. Likewise, it allows traders to perform technical analysis on crypto-assets to predict the next movement of an asset.
With no doubt, TradingView is very useful in predicting the market of an asset both in price and trend with the effective use of its tools to carry out proper fundamental and technical analyses. And there is wide availability of assets' data as gotten from different exchanges where they are trading and this can allow a user to trade on other exchanges when the Tradingview reveals an Arbitrary trade opportunity when the trading price of an asset slightly differs on two different exchanges, this is to the benefit of the trader.
An example of how effective it is to predict the market of cryptocurrency is seen in the utilization of the chart feature of tradingview where an analyst carry out analysis on different asset of choice to predict the trend and price which eventually works as predicted, this shows the capability of predicting of the market of cryptocurrencies using the features of the TradingView.
Speaking of personal experience, I use the TradingView for technical analysis and I can say, it has always come with positive results having my trade setup end up in the direction of prediction and this is one of the numerous experience of people with Tradingview, and it's an indication that TradingView is accurate in predicting the market of cryptocurrency. It is important to also note that outputs of trade setup using the TradingView should be carried out properly to maximize a positive output.
In conclusion, TradingView is effective in predicting the market of cryptocurrencies with proper utilization of its features for fundamental and technical analyses, and its services are so wide thereby covering several other stock markets.
Conclusion
In conclusion, the TradingView platform is a great platform that allow users to carry out fundamental and technical analyses utilizing several features of the platform to predict the market of a crypto asset in the quest to benefit from the market.
TradingView has been a top-rated platform for effective analysis and the utilization of its chart feature is being used by many traders in the crypto space and beyond, and several other features. These features can be accessed free of charge as there is a package for free users, overall, it's a great platform for keeping track of the market and take its benefits. Thanks to professor @yousafharoonkhan for this great lecture.
Written by;
@fredquantum
Respected first thank you very much for taking interest in SteemitCryptoAcademy
Season 3 | intermediate course class week 7
respeceted you explained very well all question, i appreciate your work,
and your review about indicator will be useful for reader ,
Why I chose Supertrend as my favourite indicator? The >Supertrend indicator eliminates the stress of finding support and resistance by an analyst as it automatically finds each level and plots the line. In addition, it supplies the buy and sells signals which are quite accurate. This feature makes me love this indicator so much, I have used this indicator numerous times and it's accurate for trading. Know that no indicator is accurate 100% as such, Supertrend indicator also gives false signals and one should take note of such occurrence to stay safe in trades.
you explained it with nice examples
thank you very much for taking interest in this class
Thank you for the review professor @yousafharoonkhan. It's my pleasure to participate in the lecture. Thank you.
Greeting dear @fredquantum. I like your work in cryptoacademy. Your are active member of this Academy. I am Beginner. As we know that the plagiarism is not tolerated in this Academy, and very strict rules are defined. I produce my own content but some times our content is accidentally match with someone content. So, in order to avoid this plagiarism, I want your guidance on how to check plagiarism of our content.
I know that online free tools are available for checking plagiarism like SmallSeo and dupplichecker. But, I'm not satisfied with the results of these tools. Performance of these tools is not up to the mark.
Kindly guide me.
How you check your Content plagiarism?
How can I check my content to avoid accidental plagiarism.
Kindly suggest the foolproof tool. It doesn't matter if it is paid.
Regards: @allan.fakeer
Sincerely,
@fredquantum
Thank you very much dear @fredquantum for kind reply. You are right on this if we prepare our post from scratch and in our worlds, then the probability of matching content is very minimal.
I am asking to check content originality for the sake of mind satisfaction that our content is really unique.
Thank You!