Crypto Academy / Season 3 / Week 6 - Homework Post for @cryptokraze | Trading Liquidity Levels the Right Way
Introduction
It's my pleasure to be present at the academy again in the sixth week of season 3. I have attended a few lectures earlier this week and this time, I am attending a lecture presented by professor @cryptokraze which is centered on Trading Liquidity Levels The Right Way and it was a great lecture to attend. I will solve the task given by the professor using this article.
Designed in Canva with a free image- Image source
1. The Concept of Liquidity Levels
In cryptocurrency, the liquidity of a crypto asset refers to the ease of trading the asset into the other assets of choice or other currencies. Now to liquidity levels, these are the levels at which different trading activities occur in the market of a crypto asset as a result of the orders that have been placed by different traders in the quest to enter/exit a trade.
In short, Liquidity levels are referred to as the different levels traders have set their orders in a market using different strategies of choice in the quest to have their orders picked. These levels can be the levels at which the traders has placed their orders to enter or exit a market and these levels provide liquidity for the orders placed to complete in an asset's market.
One of the things to notice about the liquidity levels is clear trend reversals which occur as a result of orders buy/sell filled at the levels. Let's see some examples below.
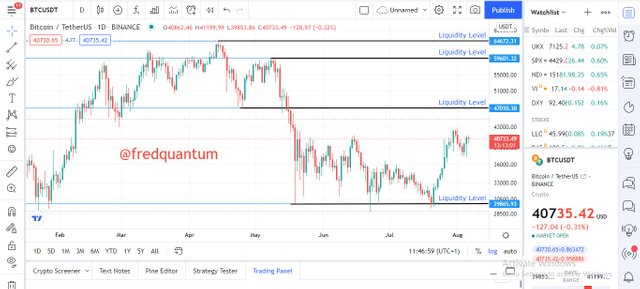
BTC/USDT chart
Above is the chart of BTC/USDT assets on 1 Day timeframe accessed through TradingView and I've marked the liquidity levels. It is realized that the price of the asset makes a high and the price was reversed at that level and that makes it the liquidity level. Also, in the downtrend movement of the asset, there exists a level where the price was triggered to go up again as a result of new purchases, and that makes another liquidity level and so on. Let's see another one below.
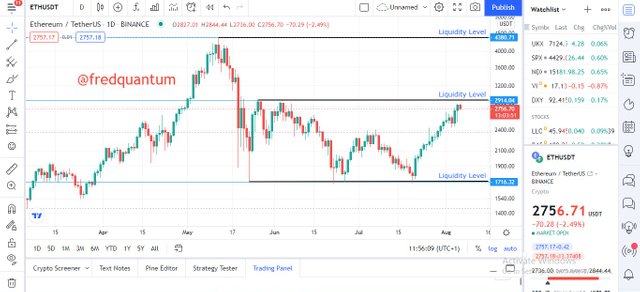
ETH/USDT chart
From the chart of ETH/USDT asset above on a 1 day timeframe. The asset was in an uptrend state when it hits the liquidity level and the market was reversed as a result of orders earlier placed by traders. This result in the downward movement of the asset's price before it was triggered to go up again at another liquidity level where traders entered the trade again.

2. Why Traders got Trapped in Fakeouts
Let's give a basis to Fakeouts, Fakeout in cryptocurrency and other financial realm happens when traders opened a position believing the current trend is certain and they would be able to make something out of the market but in short while, the asset's price moved in the opposite trend which fails in trader's initial setup.
Fakeouts can be seen as the handiwork of huge investors which could be a big financial institution or a group of traders with huge investment capital to move a market. The investor injects a huge sum into the market of an asset in a direction such that it breaks the previous liquidity level and as such, traders would make an entry believing the asset is going in a new trend after the investors have gotten enough liquidity, they inject another huge sum into the market in the opposite direction to take their huge profit. With this small traders left wandering in the trap of the fakeout.
Take for instance, in a bullish trend, after a trend reversal at the liquidity level, the financial institution enters the trade which takes the price of the asset uptrend again. Just above the break of previous liquidity level, the other traders would make a purchase believing the asset is on the rise again, after the financial institution has gotten enough liquidity, they exit and a quick trend reversal is experienced leaving the small traders that entered in fakeout hanging. Let's see some examples.
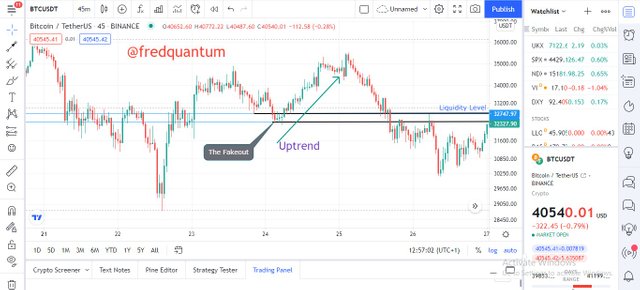
BTC/USDT chart
The BTC/USDT chart above on the 45mins time frame is used to illustrate how fakeout leaves small traders hanging. After a liquidity level where the price of the asset got triggered earlier, the huge investors which could be a financial institution made a sell entry which pushes the asset's price downtrend. The price crossed the liquidity level while the small traders entered a sell trade believing in the downward trend.
The financial institution got enough liquidity required and injected a huge trade in the opposite direction which caused a quick trend reversal to its benefits. The small traders were left hanging in the effect of the fakeout as the new trend continued for a longer time. Let's see another one below.
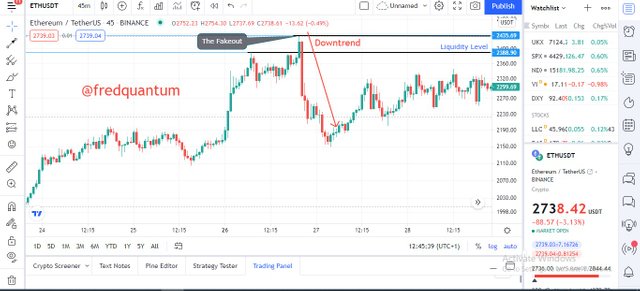
ETH/USDT chart
The ETH/USDT chart above on a 45mins time frame also shows how small traders are trapped in a fakeout following the activities of huge financial investors. The asset was in a downtrend earlier before the huge investors made a buy entry which saw the price of the asset crossed the previous liquidity level. Small traders believed in the new trend and made an entry too.
After the huge financial investors have gotten enough liquidity, they injected a huge sale of the asset which forced a quick trend reversal and to their benefit while the small traders that entered the fakeout were left in the trap.
3. How to Trade Liquidity Levels the right way
Trading Liquidity Levels the right way requires using potent trading strategies to stay safe in the journey. Some of the strategies that could be used for effective trading liquidity levels are Market Structure Break (MSB) and Break Retest Break (BRB) trading strategies to trade reversals and continuations respectively. These two would be discussed in this part.
Buy and Sell Entry Criteria for trading Liquidity Levels using the Market Structure Break trading Strategy
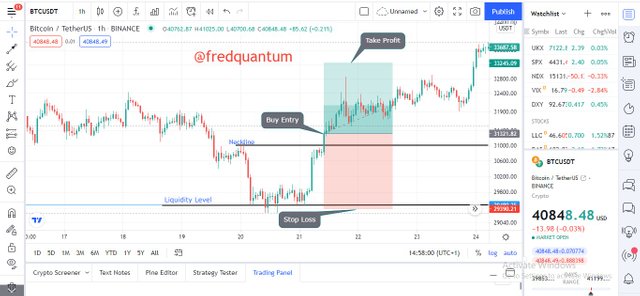
Trading liquidity levels- Buy trade entry using MSB (BTC/USDT chart at 1hr timeframe)
Trading liquidity levels- Sell trade entry using MSB (BTC/USDT chart at 1hr timeframe)
Trade Exit Criteria for trading Liquidity Levels using the Market Structure Break trading Strategy
Trading liquidity levels- Buy trade exit using MSB (BTC/USDT chart at 1hr timeframe)
Trading liquidity levels- Sell trade exit using MSB (BTC/USDT chart at 1hr timeframe)
Buy and Sell Entry Criteria for trading Liquidity Levels using the Break Retest Break trading Strategy
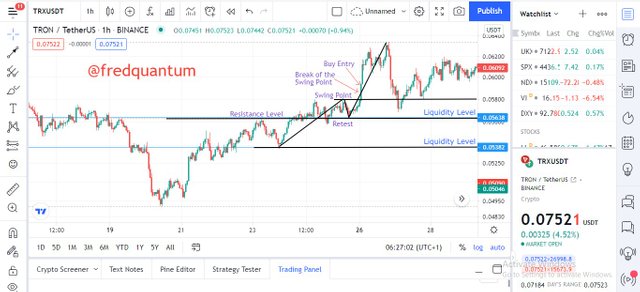
Trading liquidity levels- Buy trade entry using BRB (TRX/USDT chart at 1hr timeframe)
Trading liquidity levels- Sell trade entry using BRB (TRX/USDT chart at 45 mins timeframe)
Trade Exit Criteria for trading Liquidity Levels using the Break Retest Break trading Strategy
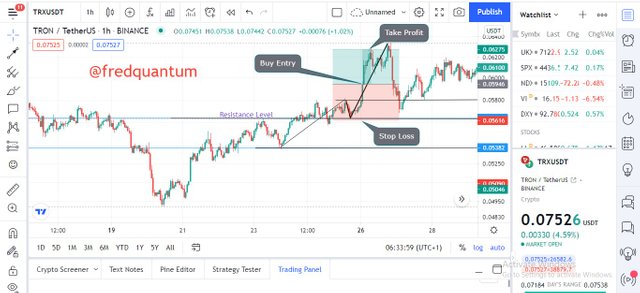
Trading liquidity levels- Buy trade exit using BRB (TRX/USDT chart at 1hr timeframe)
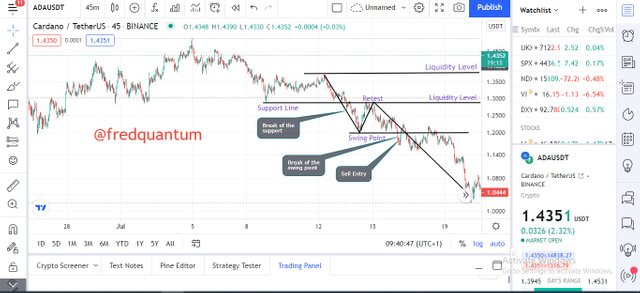
Trading liquidity levels- Sell trade exit using BRB (ADA/USDT chart at 45 mins timeframe)
4. For Setups of Buy and Sell using the MSB and BRB trading strategies
Buy Setups
The chart below shows the buy setup of the BTC/USDT asset at 1 hr timeframe using the MSB trading strategy.
Buy Setup of BTC/USDT asset using MSB
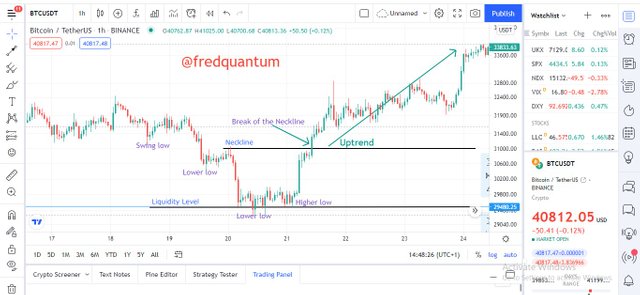
And the chart below shows the setup of the TRX/USDT asset on 1 hr timeframe using the BRB trading strategy.
Buy Setup of TRX/USDT asset using BRB
Sell Setups
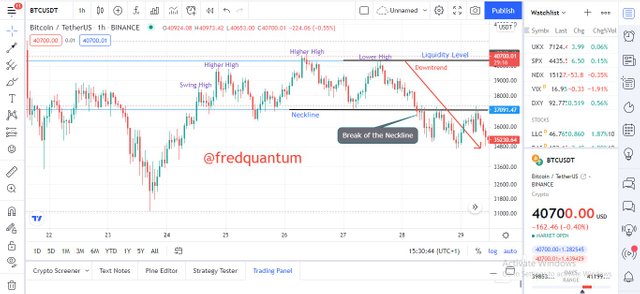
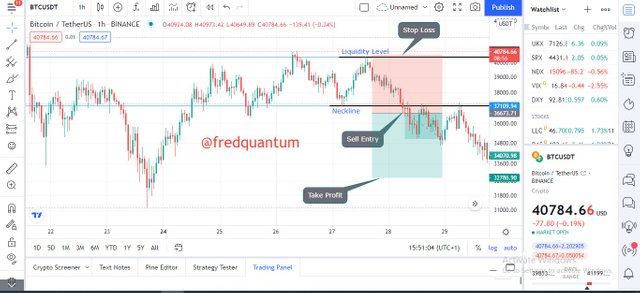
The chart below is the sell setup for the BTC/USDT asset on 1 hr timeframe using the MSB trading strategy.
Sell Setup of BTC/USDT asset using MSB
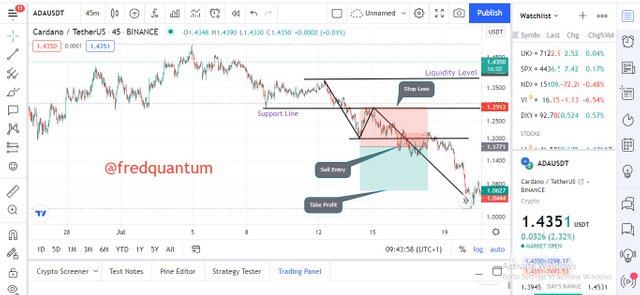
The Sell setup below is done on the chart of the ADA/USDT asset at 45mins timeframe using the BRB trading strategy.
Sell Setup of ADA/USDT asset using BRB
For all the setups, I utilized the 1:1 (R:R) risk to reward ratio putting me at an equal exposure to loss and profit. And all the charts used in this homework are from TradingView.
Conclusion
In conclusion, liquidity levels are the points at which different orders placed by traders are filled in the quest to enter or exit a trade. The orders placed earlier provide liquidity for the market and enable the orders to be filled, and notably, there exist trend reversals at these levels.
The liquidity levels can sometimes be associated with fakeouts whereby huge investors like financial institutions can move the market in a direction to get other small traders into the trade and once they have gathered enough liquidity, they inject huge sum in the opposite direction leaving small traders hanging in the fakeout. Trading the liquidity levels the right way can be done using strategies like, Market Structure Break and Break Retest Break trading strategies. Thanks to professor @cryptokraze for this great lecture.
Cc: @cryptokraze
Written by;
@fredquantum
Sort: Trending
Loading...