Crypto Academy / Season 3 / Week 4 - Homework Post for @cryptokraze | Trading The Dynamic Support & Resistance
Introduction
It's another precious time to attend the academy for the week 4 that has been running smoothly and for this session, I have attended the lecture presented by professor @cryptokraze as the professor took us on a ride about Trading The Dynamic Support & Resistance. It's a really interesting lecture to attend as it takes care of important things to know about dynamic support and resistance. I will be using this article to attend the task given by the professor.
Background to Support and Resistance
The terms support ad resistance in technical analysis are familiar as most of our decisions arise from the actions of both knowing that support and resistance are the levels where the trend of assets are likely to take the opposite trend for a short time or even experience a deep trend reversal and they exist mostly horizontally on the chart pattern. This that we already know about support and resistance is the basics as we can go deeper, and that will lead us to The Concept of Dynamic Support & Resistance. Let's go further.
1. The Concept of Dynamic Support & Resistance
The concept of dynamic support & resistance is an eye-opening concept that reveal more about support & resistance beyond the usual horizontal levels of checking for support & resistance. Often times, there are situations whereby support & resistance takes place diagonally which is quite contrary to the basics of horizontal lines of support & resistance we are used to and this open the floor for the concept of dynamic support & resistance.
As stated earlier, we are likely to see support & resistance existing diagonally and not horizontally. It's quite visible on the trend to see the price behaviour of assets being acted on by support and resistance diagonally which can be measured or noted by drawing diagonal trend lines but in this case we are using the EMA (Exponential Moving Average) technical indicator to reveal the price action of an asset against the diagonal support & resistance and this brings about the concept of Dynamic Support & Resistance with the EMA acting as our Dynamic Support & Resistance. Let's see each of the dynamic support & resistance on the chart pattern.
Dynamic Support on the Chart Pattern
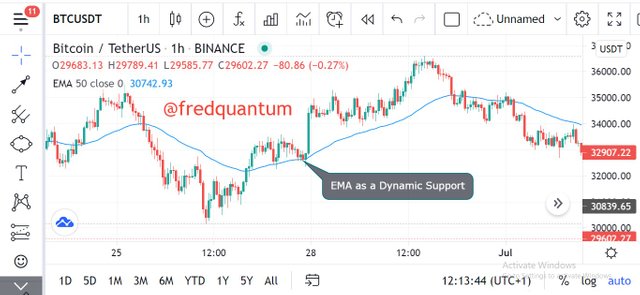
BTC/USDT chart pattern at 1 hr time frame
From the BTC/USDT asset's chart pattern on 1 hr time frame above, we can see the asset's price was moving in the downward direction but at the point where it touches the Exponential Moving Average (EMA), the price was triggered to go up again. At that point, the EMA as acted as the Dynamic Support.
Dynamic Resistance on the Chart Pattern
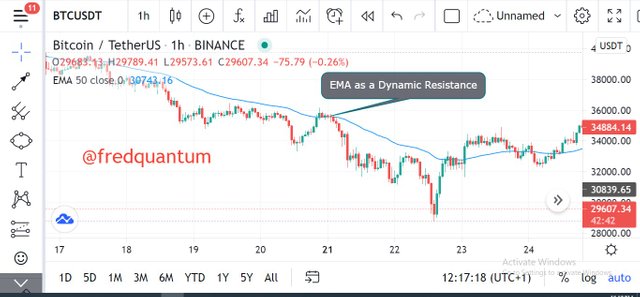
BTC/USDT chart pattern at 1 hr time frame
Similarly, the chart of BTC/USDT asset above shows the movement of of the price of the asset and EMA moving at a distance to each other for some time. The price was moving at the upward direction and at the point where it touches the EMA, the price of the asset changed direction and headed in the downward direction. From the illustration above, the EMA has acted as the Dynamic Resistance.

2. The combination of 20 and 50 EMAs to show dynamic support & resistance on the chart pattern
For this section of the task, it is important to know that the combination of EMA gives more significant dynamic support and resistance. Apart from the fact that the two can be used to identify sell/buy signal in a trend on the chart, it is also key to identify strong support and resistance. Let's see a few charts below from combining two EMAs with 20 and 50 periods.
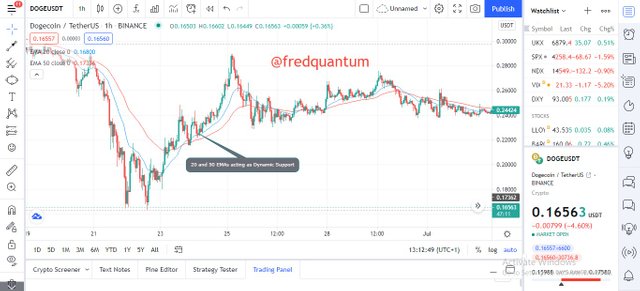
DOGE/USDT chart pattern on 1 hr time frame
From the chart pattern above of the DOGE/USDT asset in 1 hr time frame, there I combined two EMAs with 20 and 50 periods respectively. The observation from above is that the dynamic support given by the EMAs was contained within, without going below the 50 EMA. Let's look at the second chart below.
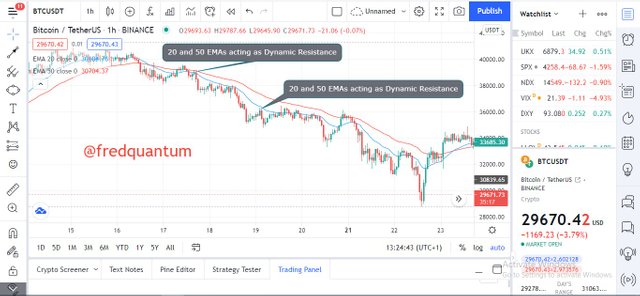
BTC/USDT chart pattern on 1 hr time frame
Also, from the BTC/USDT asset chart pattern above in 1 hr time frame, I combined the EMAs with 20 and 50 periods respectively which gave perfect dynamic resistance jointly. What to notice from the above is that, the dynamic resistance given on the chart was contained between the 20 and 50 EMAs, without the price extending beyond the 50 EMAs.
3. Trade Entry and Exit criteria for both buy and sell positions using the Dynamic Support & Resistance Strategy
For this section of the task for the Dynamic Support & Resistance trading strategy, I will be using the duo of 50 and 100 EMAs (Exponential Moving Averages) on the chart pattern. Let's get into it.
Entry Criteria for a Buy position using the Dynamic Support & Resistance Strategy
Like every other trading strategies that has different entry criteria for either buy or sell positions, I will be sharing the Buy entry criteria using the Dynamic Support in the list below.
See the result of the criteria above as I have duly applied it on the chart pattern of the BTC/USDT asset on 15mins time frame below.
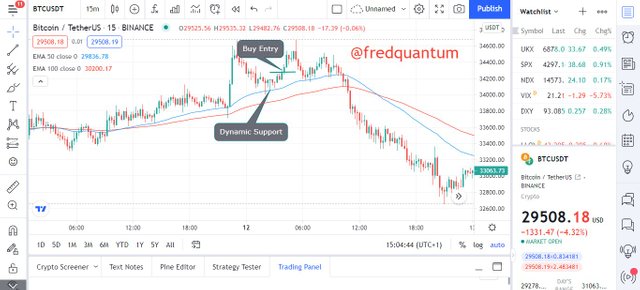
BTC/USDT chart pattern on 15mins time frame
Entry Criteria for a Sell position using the Dynamic Support & Resistance Strategy
The criteria above was clearly followed and we can see the output on the chart pattern of BTC/USDT asset on 15mins time frame below.
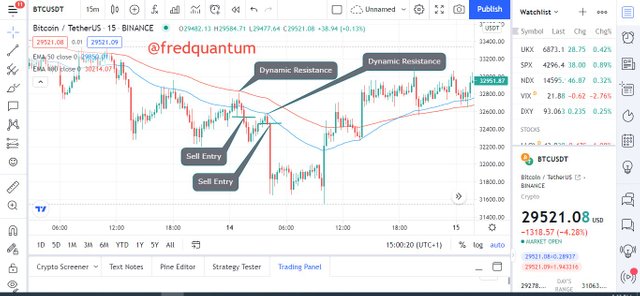
BTC/USDT chart pattern on 15mins time frame
From the chart above, I was able to get another setup after the first one. Provided the first setup has hit the profit level before going up again and I have exited, I can position myself for the second setup which is quite interesting.
Exit Criteria for a Buy position using the Dynamic Support & Resistance Strategy
I will give a list of exit criteria for a buy position in the list below and it would be followed with the chart that shows what we have in the criteria.
Let's see the criteria above as applied on the chart pattern of BTC/USDT asset on 15mins time frame.
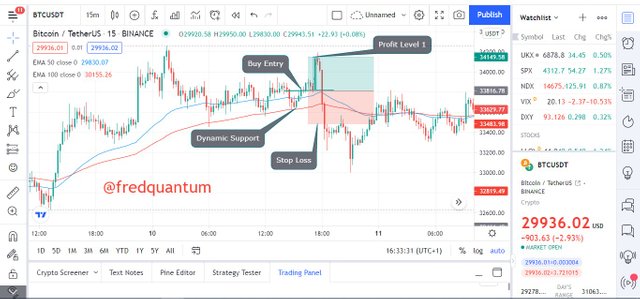
BTC/USDT chart pattern on 15mins time frame
From the chart above, I followed the criteria listed earlier, most importantly, I utilized the 1:1 RR (Risk:Reward) to be in equal exposure to taking profit and loss.
Exit Criteria for a Sell position using the Dynamic Support & Resistance Strategy
Let's see the criteria applied on the chart pattern of BTC/USDT asset on 15mins time frame below.
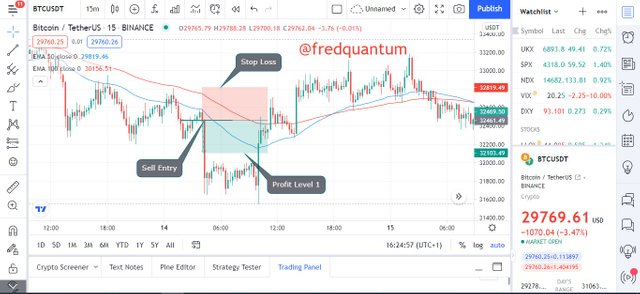
BTC/USDT chart pattern on 15mins time frame
Similarly, the ratio of risk to reward used on the chart above is 1:1 RR putting my setup on an equal exposure to profit and loss.
4. Performing 2 Demo Trades
For this section of the task, I will be placing two different trades having one for the buy position and the other one for a sell position. The buy position would be placed on the Binance spot trading platform while the sell position would be placed on the MetaTrader 5.
Buy Position using the Dynamic Support and Resistance Strategy
2.png)
ATM/USDT chart pattern on 15mins time frame
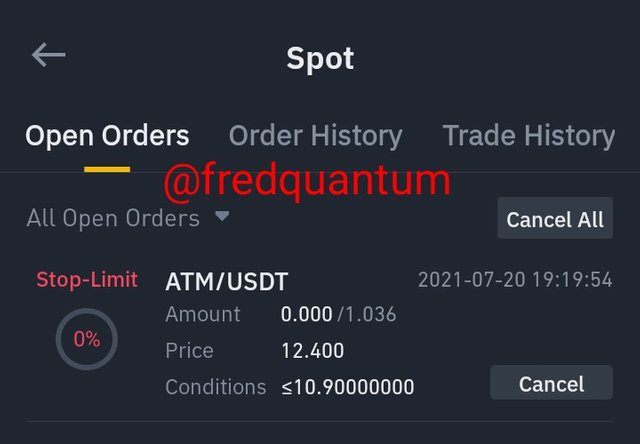
From the chart of ATM/USDT at 15mins time frame above, the price of the asset has been above the EMAs (50 and 100) for some time, the price comes down and crosses the 50 EMA. The price moved upward again and I placed my buy entry when the price crosses above the 50 EMA again. Let's see the trade details below.
Buy Entry: 11.6 USDT.
Profit Level 1: 12.4 USDT.
Stop Loss: 10.9 USDT.
The stop loss level in this trade was placed just below the 100 EMA and the profit level was placed at 1:1 RR putting me at equal exposure to profit and loss. See the screenshots below for the buy order.

ATM filled buy order on Binance spot trading platform
Sell order placed with stop loss and take profit levels
Sell Position using the Dynamic Support and Resistance Strategy
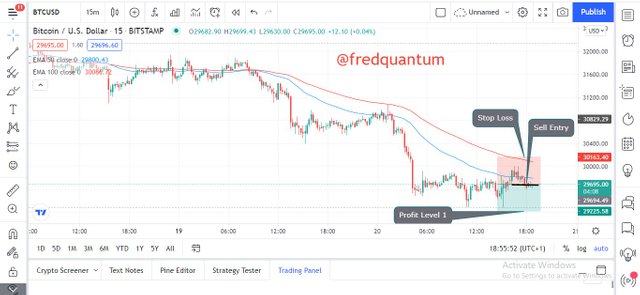
BTC/USD chart pattern on 15mins time frame
Above is the chart of BTC/USD asset on 15mins time frame whereby the price of the asset and the EMAs (50 and 100) have been moving at some distance apart earlier having the price below the EMAs. The price of the asset moved upward and crosses the 50 EMA then I waited for the price to come down again and I placed the sell order below the 50 EMA when the price drops below it.
Sell Entry: 29,690 USD
Profit Level 1: 29,224 USD
Stop Loss: 30,159 USD.
The stop loss level above was placed just above the 100 EMA and my profit level was placed at 1:1 RR positioning me at an equal exposure to profit and loss. Let's see the screenshot of my sell position demo trade placed below.
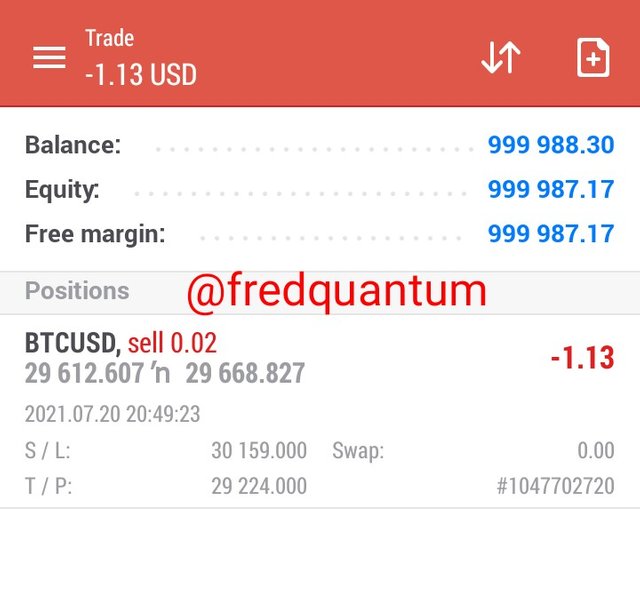
Sell order placed with stop loss and take profit levels on MetaTrader 5
Conclusion
The dynamic support & resistance trading strategy can be utilized for trading in the crypto ecosystem to gain early access into the market as the Exponential Moving Average technical indicator gives the dynamic support & resistance that helps in the process of entry into a trade early enough.
In addition, this strategy can be used at any time frame of choice and the EMAs (for example, 10 and 20 EMAs, 20 and 50 EMAs, 50 and 100 EMAs...) can be combined for stronger revelation of dynamic support and resistance. Traders must be careful enough while using this strategy as it requires certain criteria that is required to be fulfilled. Thanks to professor @cryptokraze for this masterpiece.
Cc: @cryptokraze
Written by;
@fredquantum
Dear @fredquantum
Thank you for participating in Steemit Crypto Academy Season 03 and making efforts to complete the homework task. You got 9.5/10 Grade Points according to the following Scale;
Key Notes:
*.You have shown good understanding of the strategy by making precise charts for different elements of the strategy. One suggestion is that you should try to enter on 1st or 2nd retest. Your buy charts were marked a bit late on 3rd touch.
We appreciate your efforts in Crypto academy and look forward for your next homework tasks.
Regards
@cryptokraze
@fredquantum please what software did you use in question number 4 for the demo trade, I would love to learn