Crypto Academy / Season 3 / Week 2 - Homework Post for @cryptokraze | Market Structure Break (MSB) Strategy to Trade Reversals
Introduction
It's another wonderful time to attend the academy again at this moment of the day for another session of learning from our crypto professors and this time, I've attended the lecture presented by professor @cryptokraze which was centered on Market Structure Break Strategy, indeed, it was an awesome lecture to participate in. I will be solving the task given by the professor with this piece of article.
1. What do you understand about Market Structure?
Market structure is the representation of an asset on the chart pattern that shows the price movement of the asset in question over time. The pattern on the asset's chart represents the price behavior of an asset at a certain period, show its state and one can easily identify the trend of the asset. The representation of the movement of the asset can be an uptrend movement or downtrend movement or sideways movement, and this amounts to the Market Structure as represented on the chart pattern.
In addition to the concept of the market structure, the price behavior of assets at different time frame of choice presents different price information about the asset, where there exists support/resistance, trend reversals and so on, this information is utilized by the analyst to gain insight into the market before making a trading/investment decision. Let's take a look at some of the different market structures in the next section.
Market Structure for an Uptrend Movement
With the basic knowledge of an uptrend movement in the crypto ecosystem, we can see that it is the upward movement of the price of an asset. In other words, it is termed a bullish trend that shows that the price of an asset in rising. The market structure for this clearly show that the asset is moving in an uptrend direction with the representation on the chart pattern. Let's see the chart below.
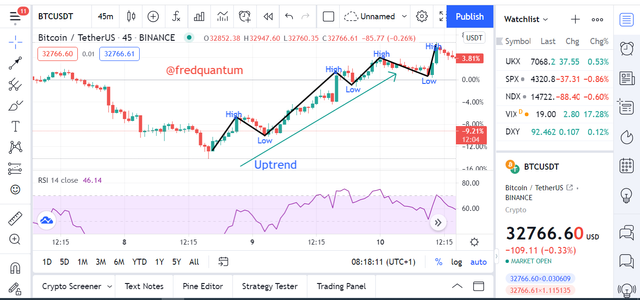
Uptrend Market Structure
Market Structure for an Downtrend Movement
For a downtrend movement, the chart pattern shows that the price of the asset in a downward trend which also means it's bearish. The pattern of this trend would clearly show the downward price behaviour of the asset at any time frame of choice and this kind of movement can be related to heavy sale of the asset. Let's see the chart below.
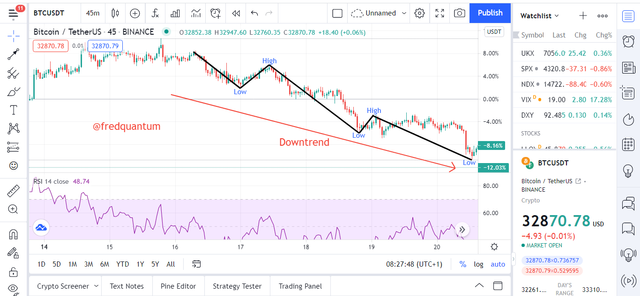
Downtrend Market Structure
Market Structure for Sideways Movement
This type of pattern is seen on charts when the price of an asset moves within a region. The pattern is always seen to be moving in a horizontal direction with no clear trend movement, as such, supports and resistance exists to push the price towards the uptrend direction or pull the price towards a downtrend direction. And in this way, we can say the supply and demand for the asset are nearly equal. Let's take a look at the chart below.
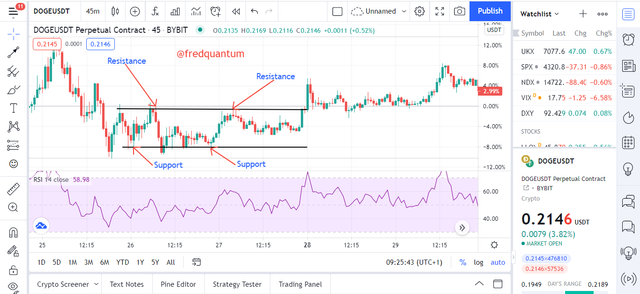
Sideways Market Structure

2. What do you understand about Lower High and Higher Low? Give Chart Examples from Crypto Assets.
For this part of the task, we are required to talk about Lower High and Higher Low but it is important to know that these two concepts are not complete without talking about the process that gave birth to them, as such, I will be exploring the entire concept of high and low which encompasses; higher high, lower high, lower low and lower high. Let's get into it.
Higher High
Higher high is a concept that is seen to have sprout from a bullish trend, which means we see this in an uptrend market. Let's keep this simple, in an extremely bullish trend of an asset, as the movement upward continues there are points where a slight trend change would be experienced due to the activity of some investors that sold off some of their assets and as such, the price of the asset would be pulled down a bit. After the slight trend direction change, the trend continues in the former direction (uptrend) and in that way, it creates another high that is higher than the first high before the slight fall, this is the concept of Higher High. Let's check on the chart below.
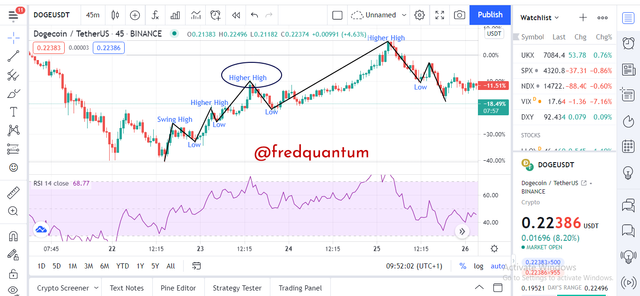
Higher High
Lower High
Having talked about Higher high, now let's look at the concept of Lower High. Lower high is the type of high seen when a bullish trend experiences a trend reversal such that, it goes in the opposite direction (downtrend). On its way down, a few more investors would buy more of the asset which will trigger the price of the asset to rise again to create a new high but the new high won't attain the high where the reversal first took place, and that is the concept of Lower high. Let's see the chart below.
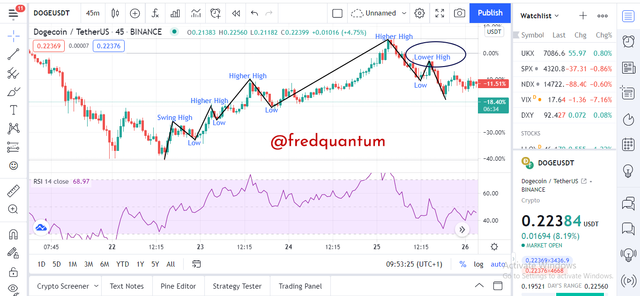
Lower High
Lower Low
Lower low is a case that occurs in an extremely bearish market whereby the price behavior of the asset in question goes downtrend. In the extreme bearish trend, there are points where the asset would change direction due to buy activities of the trader but in a short while, it will continue in the former trend (bearish) and create another low that is lower than the previous low where the price of the asset was triggered to have a slight trend change, this is the concept of Lower low. Let's check on the chart below.
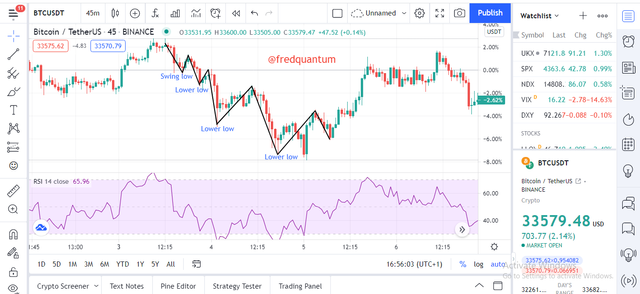
Lower low
Higher Low
When an asset's price pattern in a bearish trend experiences a trend reversal which could be credited to the involvement of more investors in the asset's market such that its price gets triggered to move in the opposite direction (uptrend). And on its way up, if it faced a resistance such that the price falls again but didn't reach the last low (support) where the trend reversal initially took place then we have a Higher low because it is formed above the previous low point. Let's see the chart below as well.
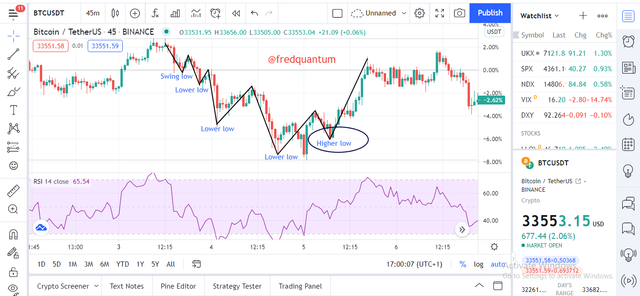
Higher low
3. How will you identify Trend Reversal early using Market Structure Break?
It is possible to identify a trend reversal in either trend (uptrend or downtrend) earlier than other analysts, credits to the use of the Market Structure Break strategy. The basic thing to watch out for using this strategy in a bullish market is the formation of a lower high at the top of the chart pattern and for a bearish market, we should watch out for the formation of a higher low at the bottom, followed by other conditions. Let's take a look at the use of this strategy properly.
How to identify a trend reversal early in a Bullish trend using MSB
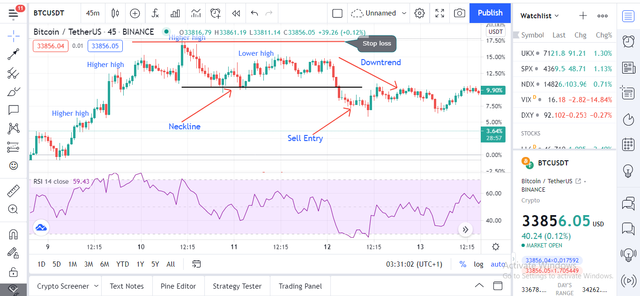
The first thing to take note is that a lower high is formed at the top of the bullish trend, if this is noticed, draw a neckline (support line) and if the support line is clearly broken, then you should be sure there is trend reversal, and that'd help me as an analyst to make timely decision to be on a safer side. Lets see the chart below.
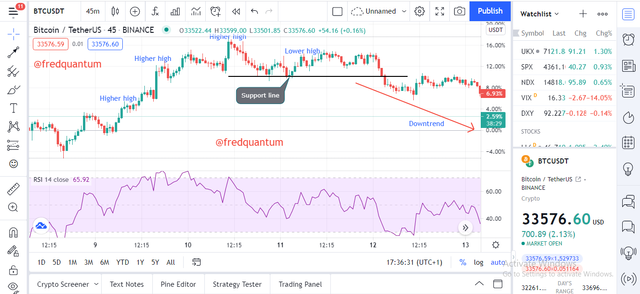
Identifying early trend reversal in a bullish trend using MSB
From the chart above, it is clearly seen that the neckline after the Lower high was broken and there exist a trend reversal, as the trend becomes bearish.
How to identify a trend reversal early in a Bearish trend using MSB
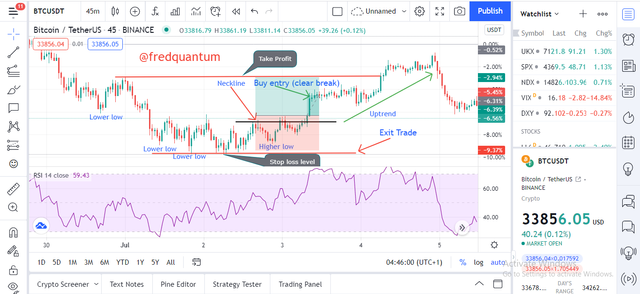
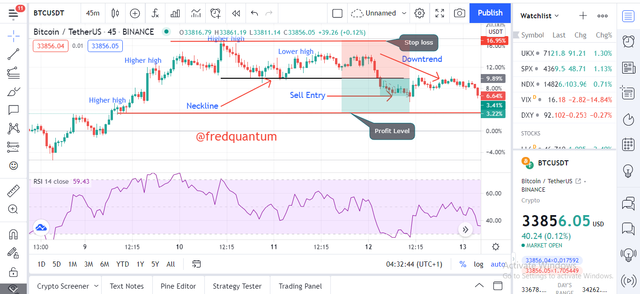
In a bearish trend having consistent lower lows, if there exist a higher low such that the neckline (resistance line) that birthed the higher low is marked out, then I wait to see if the line would be broken. If the line is broken, then we should expect a trend reversal such that the trend moves in an uptrend direction.
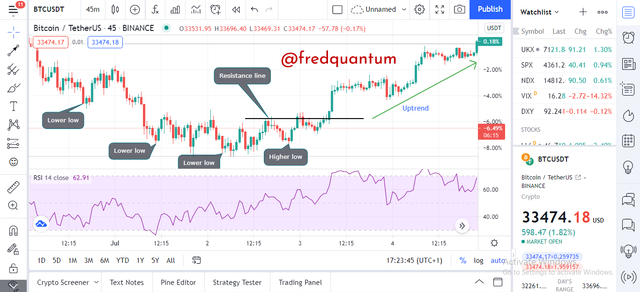
Identifying early trend reversal in a bearish trend using MSB
Take a look at the chart above, a higher low was formed, with the price breaking the neckline to go extremely bullish.
4. Explain Trade Entry and Exit Criteria on any Crypto Asset using any time frame of your choice
For this part of the task, I will be discussing the trade entry and exit criteria different criteria in a few steps. The trade entry could either be a buy or sell position in a trade while the exit could be an exit when one is in loss or profit. Let's take them one after the other below.
Buy Entry Criteria
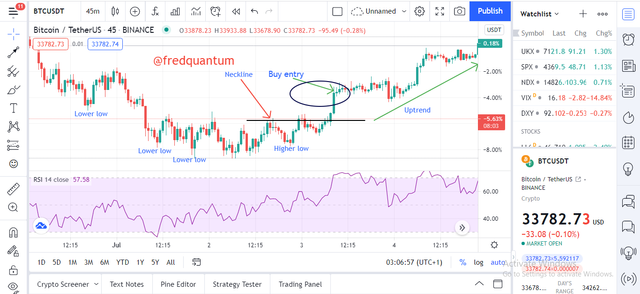
Buy entry
Sell Entry Criteria
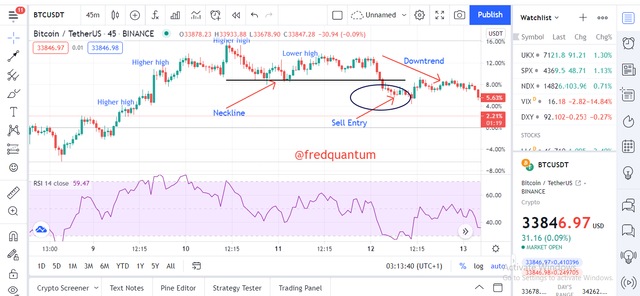
Sell entry
Having discussed the trade buy and sell entry in a few steps above, it is necessary to talk about the trade exit too. Let's see a few things below.
Trade Exit Criteria (In loss)
It is necessary to put the adequate stop loss in place in every trade to avoid excessive loss, as such, it is required that using the Market Break Structure, there should be a proper stop loss put in place should in case our position goes wrong. Let's see what we have on this.
Buy trade exit (in loss)
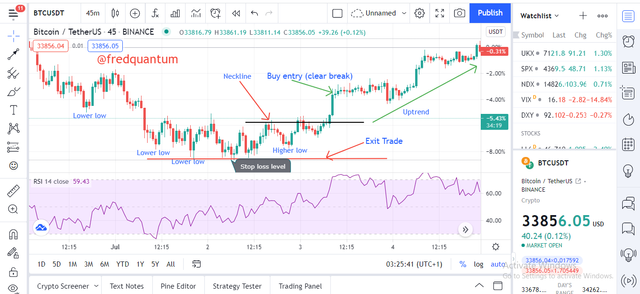
Stop loss in a buy trade using the MSB
Sell trade exit (in loss)
Stop loss in a sell trade using the MSB
Trade Exit Criteria (In profit)
Just as it's important to set stop loss in a trade, same way it is important to set profit taking levels which could more than one, for example, Profit level 1, Profit level 2, Profit level 3 and so on. The profit levels above is based on individual trader's preference, in the ratio of risk to reward. Let's see the charts below.
Buy and Sell trade exit criteria (in profit)
Profit exit (1:1)- Buy
Profit exit (1:1)- Sell
5. Place 2 demo trades on crypto assets using Market Structure Break Strategy. You can use lower timeframe for these demo trades
For this part of the lecture, I will be considering the assets ADA/USDT and TRX/USDT at different time frames on the chart. And the trade on this would be real trades.
i. ADA/USDT chart pattern
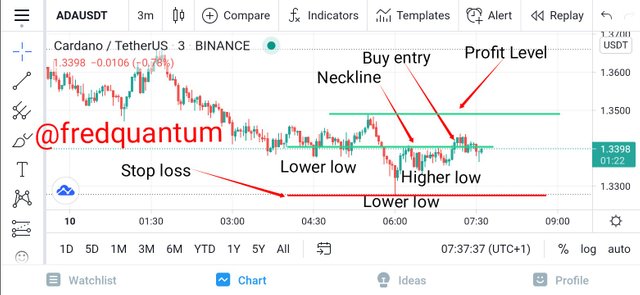
ADA/USDT at 3mins time frame
My favourite trading time frame is 45mins but in this case, I am bending a bit to a lower time frame on the ADA/USDT asset. In a downtrend movement of the asset, there has been many consecutive lower lows, along the line a higher low was formed and I marked the neckline, the neckline was broken which opened way for a purchase. I made a purchase at 1.3384 USDT. See the screenshot below.
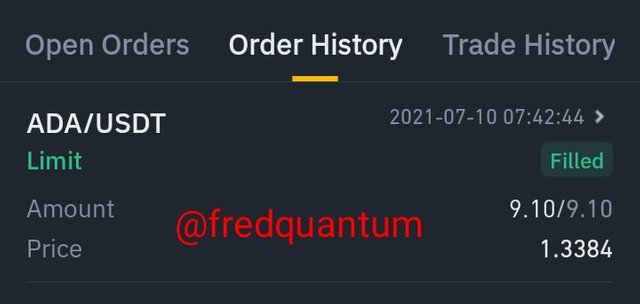
Purchase- Binance spot
My take profit was taken above my buy area and it's precisely marked out at 1.3487 USDT as seen in the chart above, and my stop loss put in place at low 1.3275 USDT under the higher low.
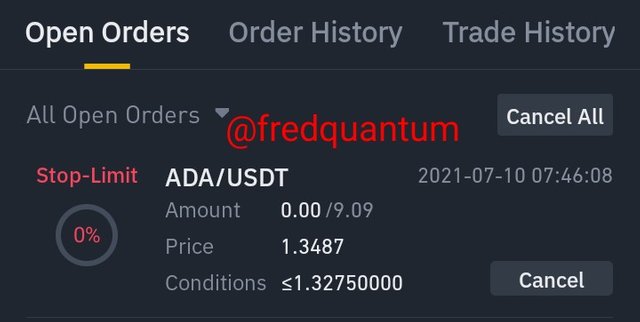
Sell order placed- Binance spot
ii. TRX/USDT chart pattern
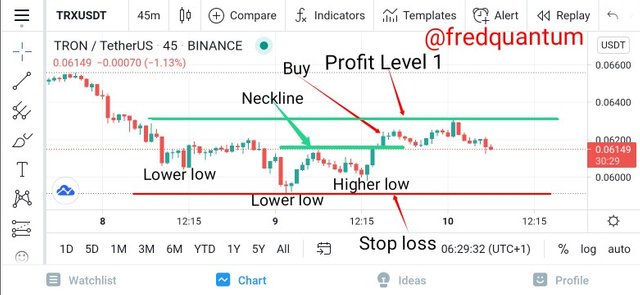
TRX/USDT at 45mins time frame
At my preferred 45mins time frame, I explored the TRX/USDT chart pattern. The market was in a bearish trend with many consecutive lower lows until there was a formation of a Higher low, I marked out the neckline and it was broken in a short while, and this is a sign of a bullish trend such that made a purchase at the price 0.06158. Let's see the screenshot below.
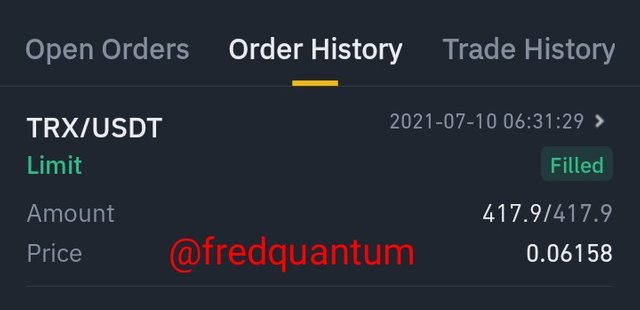
Purchase- Binance
From the chart provided earlier, I placed my take profit level at the nearest resistance, 0.06307 USDT and the stop loss was placed at 0.05913 USDT. Let's see it below.
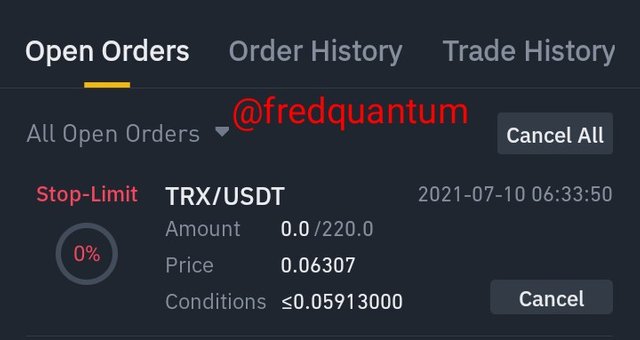
Sell order placed- Binance spot
Both trades placed above have nearly equal exposure to risk and reward (1:1) with slightly increased proportion of risk but that's the best I can get in that position for a quick take profit.
Conclusion
In conclusion, the Market Structure Break strategy is a very useful trading strategy that enables a trader to get an early insight into a trend reversal that is to take place in an asset's market, earlier than other traders that uses a different strategy. And by this, they can position themselves for an early entry.
There is no way we would talk about Market Structure Break Strategy without mentioning the higher low and lower high as this marks the first action when a market is about to be reversed in trend with the former formed at the bottom of a bearish trend and the latter formed at the top of a bullish trend. Thanks to professor @cryptokraze for this great lecture. Thank you all.
Cc: @cryptokraze
Written by;
@fredquantum
Thanks for the review professor @cryptokraze. I'm glad to have participated in the lecture. Thank you.
Bro I read your assignment posts. Excellent work mate
Thank you dear @huzaifanaveed1. I'm so glad you appreciate this piece from me. Thank you and I wish you the very best of luck.