Crypto Academy / Season 3 / Week 1 - Homework Post for @kouba01 | Trading Crypto With Ichimoku-kinko-hyo Indicator - Part 1
Introduction
It's with great honor I'm writing again in the academy as the new season- Season 3 began. It feels so good to have our professors back on the track of teaching quality crypto lessons and for this week, I have attended the lecture by professor @kouba01 which was centered on the topic Ichimoku-kinko-hyo Indicator. This article would be used to attend to the task given by the professor.
1. What is Ichimoku-kinko-hyo Indicator?
Ichimoku-kinko-hyo Indicator is yet another technical indicator used on the chart pattern of an asset for analysis that is based on the theory of All-in-One. Going briefly into the history of this technical indicator, it is an invention of a Japanese journalist known as Hosoda Goichi and this technical indicator has its meaning in English to simply be
The Balance Chart From One Look. Going further, a few things can be seen in the meaning transcribed above but technically, Ichimoku-Kinko-Hyo Indicator is the type of technical indicator which operates on the basis of showing the trend, supports and resistance, other price behaviour of an asset over time all in a chart creating a balance of analysis. Such that it monitors the price behavior of an asset over time and how it returns to equilibrium before continuing in a trend.
The ideal theory of this indicator is identifying trends and price behaviours of the asset with inclusion of how the price of the asset returns to the state of equilibrium over some time before continuing in a trend. Take, for instance, an uptrend market that experiences a trend reversal to come back to equilibrium before continuing in the previous trend, showing supports and resistances on the move all in one chart, this is exactly what the Ichimoku-kinko-hyo Indicator measures to give traders/investors insight into a market.
Distinctive features of Ichimoku-kinko-hyo Indicator
There are a few points that distinguished this indicator
from other technical indicators and some of which would be listed in the points
below;
- Ichimoku-kinko-hyo Indicator is quite easy to set up on the chart pattern without the need to involve one in writing any additional equation to complete its setup.
- It utilizes the trend in an asset's market to indicate several price behavior of the asset over time to allow traders to make decisions as regards entry and exit into the market.
- It can be used independently without combining it with other technical indicators, knowing that the true success of some indicators solely depends on their combination with other indicators but that's not the case in Ichimoku-kinko-hyo Indicator as it can be used independently.
- The analysts using this technical indicator do not need to draw out several positions as the Ichimoku-kinko-hyo Indicator would have marked out several signals.
- As the price of the asset tends towards equilibrium using this indicator is useful to mark out supports and resistance in a trend that would help traders to make decisions in the market.
Different lines in Ichimoku-kinko-hyo Indicator
The lines, in this case, are also referred to as the components of Ichimoku-Kinko-Hyo Indicator which are 5 in numbers; Tenkan Sen, Kijun Sen, Senkou Span A, Senkou Span B, and Chikou Span. Let's briefly talk about these components in the 3 groups below.
The Tenkan Sen and the Kijun Sen: These two lines both indicates the price volatility of an asset over time, with the Tenkan Sen line considered as the fast line as it indicates the price volatility while the Kijun Sen line is considered as the slow line which indicates the long-term price volatility. And they are the midpoint or median level of the lows and highs of an asset over time.
The Tenkan Sen is calculated over 9 periods while Kijun Sen is calculated over 26 periods. Calculation for both lines are done through the formula; (Highest High + Lower Low)/2. Let's take a look on the chart below.
.png)
The Tenkan Sen and Kijun Sen lines on Chart pattern
The Senkou Span A and the Senkou Span B: These two lines are the components of this indicator which are projected into the future and whereby we have Senkou Span A to be the average of
Tenkan Sen and Kijun Sen lines projected 26 periods into the future,
calculated through the formula; (Tenkan + Kijun)/2 i.e summation of
Tenkan and Kijun divided by 2.
Speaking of Senkou Span B, it is the median of the
Highest high and Lower low over the last 52 periods and projected 26
periods into the future. It is calculated by the formula; (Higher + Lower)/2
but on a period of the previous 52 periods and projected 26 periods into the
future.
An area known as Kumo or Cloud is formed
between the combination of Senkou Span A and Senkou Span B
lines which is colored and enables analyst to identify the trends of an asset on the
chart pattern. Let's take a look at the Senkou Span A and Senkou Span B
below.
.png)
Senkou Span A and Senkou Span B- Koma Identified
Chikou Span: This is the line that represents
the closing prices of an asset in the previous 26 periods and often regarded as the
Lagging Span. Let's take a look on the Chikou Span below.
.png)
Chikou Span

2. How to Add Ichimoku Kinko Hyo indicator on the Chart pattern
The processes involved in setting up Ichimoku Kinko
Hyo indicator on the chart pattern would be highlighted in the list of steps to be
followed below. Note that, I will be using TradingView to access the
charts.
- Visit tradingview.com/ and navigate to charts from the homepage.
- From the chart interface, select the Indicators option at the top of the page.
- On the next page, search for the Ichimoku Kinko Hyo indicator and select one from the list.
- Go back to the chart and the indicator is fully set up. Screenshots below.
.png)
TradingView Chart page
.png)
Search for Ichimoku Kinko Hyo
.png)
Ichimoku indicator setup
Ichimoku Indicator Defaults
Just like every other technical indicators, there are
defaults set by the developers which can be set to preferences of individual analyst,
so as well the Ichimoku indicator has defaults which can be accessed at the settings
area on the indicator, it is sectioned into two which are; Inputs and Style.
Inputs
The basic parameters under Ichimoku indicator's
settings is the Length (Period) of each lines which consists; Tenkan
length, Kinju length, Chikou Span length, Senkou Span A length and Senkou Span B length. At default, the lines are characterized with the following length
parameters.
- Tekan Sen- 9.
- Kijun Sen- 26.
- Chikou Span- 26.
- Senkou Span A- 52.
- Senkou Span B- 26.
Understanding the parameters above, the length
represents a certain period on the charts of an asset. Knowing that this indicator was
created by a Japanese where Saturday is added as a fully working day having 6
days working day in a week as such, the length 9 represents a period of one
and a half week, 26 lengths representing a month (from 30 days a
month assumption excluding the 4 Sundays), and 52 lengths representing a period of two
months (26 X 2).
.png)
Ichimoku Settings- Inputs' length defaults
Style
Ichimoku's indicator' style can be accessed through the
settings to see the Style settings. The defaults we have in this case is the
color for each lines. The screenshot below shows the details of the color set at default on the indicator. In addition, we have Precision settings on the indicator's style which is set to default.
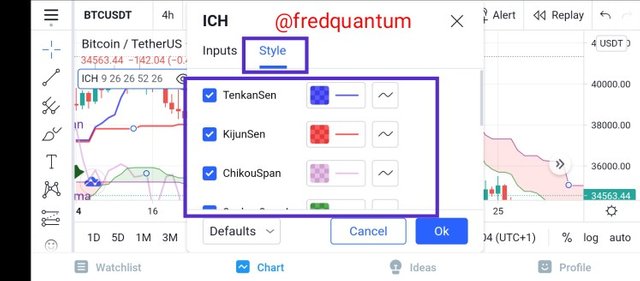
Ichimoku Indicator- Style's color parameters
.png)
Ichimoku indicator- Style's precision parameters
Should Ichimoku's default parameters be changed or not?
Settings on technical indicators can be changed to users' preferences, and Ichimoku's is not an exception, therefore, Ichimoku's settings should be changed if the analyst wish to. What matter most before changing the parameters is having the basic understanding of the period and the color that one wishes to use to represent each line.
For instance, the default period on the indicator are (9, 26, 52) which represents the trading days in one and a half week, a month and two months respectively such that I can change my settings to desired like (10, 22, 44) on a basis of 5 working days a week. From the illustration stated earlier, 10 indicates two weeks trading period, 22 indicates a month trading period excluding the weekends (Saturday and Sunday) and 44 indicates two months trading period, note that, this is not a standard, I'm just working around setting the parameters to users' preference.
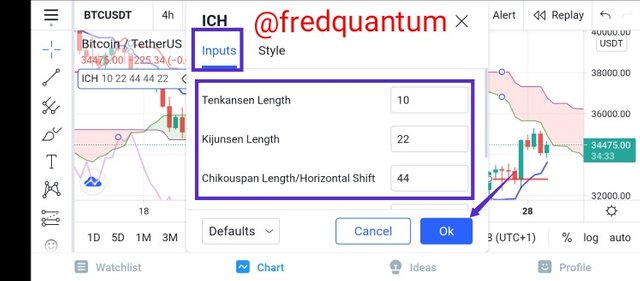
Altering the Input settings
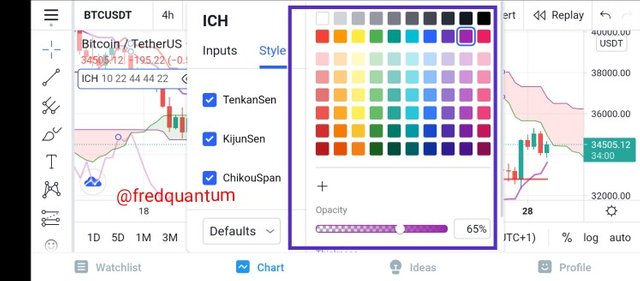
Selecting preferable colour under style
3. How to use the Tenkan Sen line?
Before talking about the usefulness of this component of the Ichimoku indicator, it is important to understand its basis. Know that, Tenkan Sen line is regarded as the fast line of the Ichimoku indicator as it measures the price volatility of an asset over time in a short term, that's where it derived the name fast line. In addition, it represents the highest high and lower low of an asset over a period of 9.
Now to the uses, it's used to determine the trend of an asset at a particular period in time and the indication is seen by the analyst through the line that either move in an uptrend direction (bullish trend) or downtrend direction (bearish trend) which helps to gain insight into the market trend before deciding on such asset's market.
Apart from the fact that it helps in identifying the trend of an asset on the chart pattern, it also helps in determining a point of support or resistance when an uptrend or downtrend seizes to proceed in either trend and as such, this would enable an analyst to wait for a confirmation before proceeding. It's quite awesome when used with the Kijun Sen line and that would be discussed sooner. Let's take a look at the chart below.
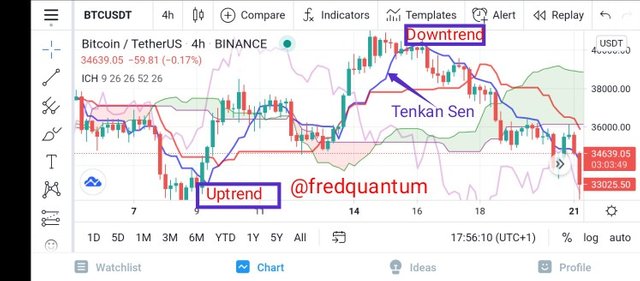
Tenkan Sen line on a chart pattern
From the screenshot above, the Tenkan Sen line moves closely with the price of the asset and clearly shows the trend in which the asset moves. The uptrend and downtrend movement as indicated by the Tenkan Sen line is marked out on the chart above.
How to use the Kijun Sen line?
Speaking of this, Kijun Sen line is regarded as the show line which is used to determine the price behavior of an asset for a long-term purpose. This operates based on 26 periods which means the higher high and lower low is considered here to give this line output. It's identical in the calculation to the Tenkan Sen line only that it's for the long term with 26 periods of higher high and lower low divided by 2.
Now to how it is used, consider the Kijun Sen line is above the price of the asset on the chart pattern, for a long-term purpose, there is the probability the trend of the assets continues in an uptrend direction and also when the Kijun Sen line is below the price of the asset on the chart pattern, there is the probability that the asset continues in the bearish direction. Let's take a look at the chart below.
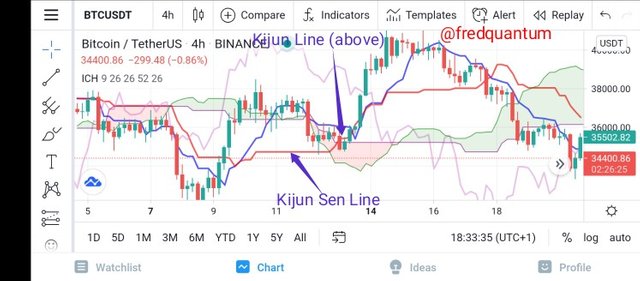
Kijun Sen line above the price
And from the chart above, the Kijun Sen line appeared above the price of the asset and the price continued in a long bullish trend which satisfies the earlier stated point; when Kijun Sen line appears above the price of the asset, there is the probability that the asset would continue in the bullish trend.
How to use the Tenkan Sen line and Kijun Sen line together?
The use of these two lines of Ichimoku indicator becomes simpler when used simultaneously. How? When these two are used together simultaneously, it gives clear indication for analyst to enter or exit an asset's market as such, when we have the Tenkan Sen line above the Kijun Sen line, that's an indication that the market is going bullish and traders can easily place a buy position to take advantage of the bull run ahead.
Likewise, when we have the Kijun Sen line above the Tenkan Sen line, that is an indication of a downtrend which signals to take sell position and prepare to enter the market again if so wish. Let's see a chart below.
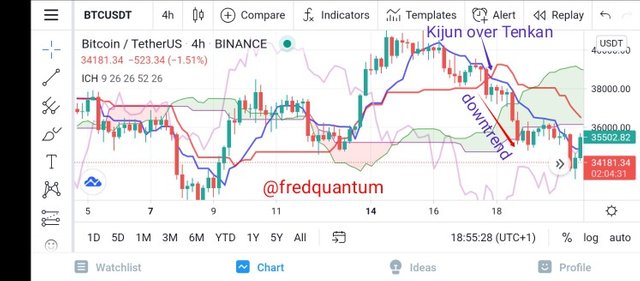
Kijun Sen line above Tenkan Sen line
The screenshot above shows a situation whereby the Kijun Sen line appears above the Tenkan Sen line and a downtrend was experienced from the point where the crossing-over action took place and the trend goes extremely bearish.
4. What is the Chikou Span line?
Chikou span line is one of the 5 components of the Ichimoku indicator which is regarded as the lagging line which measures the closing prices of assets on the chart in the previous 26 periods. In short, it estimates the past closing prices of assets at 26 periods before the recent closing price.
How to use the Chikou Span line?
Chikuo span line is an important component of the Ichimoku indicator which can be used to enter or exit an asset's market based on its position on the chart of the asset in question. Going further, the Chikou span line gives an insight about the past closing price behavior of the asset as compared to its recent closing price and likely trend reversals that tend to take place as plotted from the 26 periods before the current period.
Noting that, Chikou span line is often at a distant position to the price of an asset on the chart pattern but when the line crosses over the price of the asset, it's an indication that the market in going bullish and it's an indication for an analyst to place a buy order. Also, when the line crosses below the price of the asset, we should be expecting a trend reversal in a bearish direction and this indicates a sell position for a trader. Let's see what it looks like in the chart below.
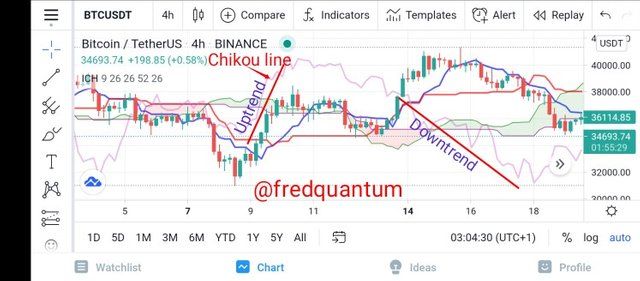
Chikou span line- Above and below the price
The screenshot has a clear indication of the Chikou span line above the price of the asset and of course, it was indeed an uptrend movement for the asset, likewise, when the line surfaced below the price of the asset, it experiences a downtrend movement which satisfies the theory behind the Chikou span line.
Why Chikou Span is often Neglected?
There are several reasons to which Chikou span line is neglected and some of which are listed below;
- Chikou span line measures the closing price of an asset in 26 periods before the current closing and as such, it gives no future forecast of the price behavior of the asset.
- Just like every other technical indicator, it might appear as an indication of uptrend or downtrend movement with no visible action seen on the chart pattern of the asset.
- It's often neglected when the line crosses over and below the price concurrently, with no clear indication of any trend.
- It might not be efficient enough to make trading decisions without combining it with other components of the Ichimoku indicator, as such, users tend to neglect it.
5. Best time-frame to use the Ichimoku Indicator
Basically, the Ichimoku indicator can be used at any time-frame which is solely depending on the nature of the trading a user chooses to go with or rather put it as, based on the trading pattern of an individual analyst.
Nevertheless, short-term traders can go with low time-frame like minutes to a few hours and for the long-term traders, they can choose higher time-frames like the daily or the weekly time-frame as this would be more clearer for them to analyse the market for their long-term trading purpose.
For emphasis, the Ichimoku indicator is suitable for all types of traders, be it short-term or long-term traders and at any time-frame of choice which starts from a minute upward. For example, short-term trader can go with time-frame chart of 1 minute to 6 hours while long-term traders can choose the longer time-frame chart which could be daily or weekly.
Best indicator to use with the Ichimoku Indicator
One special features of the Ichimoku indicator is the fact that it can be used independently without combining any other indicator. Reason been that the Indicator is an All-in-One indicator that enable users to identify the trend of an asset on the chart pattern, the supports and resistance to gain insight into the market, and the current price in the recent periods even to the previous periods, all seen in just one chart.
Nevertheless, the success of technical indicators is more appreciable when used with other indicators and in the case of Ichimoku indicator, it's best to combine the Relative Strength Index (RSI) to be sure of signals shown by the Ichimoku indicator. Let's see the RSI in combination with Ichimoku indicator below.
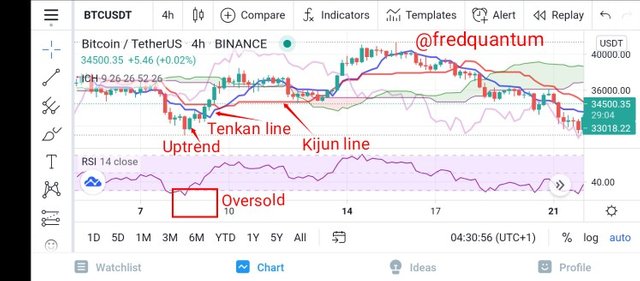
Ichimoku used with RSI on the chart
Observation: From the chart above, an oversold signal was shown by the RSI around 23% which is an indication for a trend reversal, of course, a bullish divergence took place and the price goes up, the Ichimoku's delayed the crossing over of the Tenkan Sen line over the Kijun Sen line which results in late bullish signal. In short, the market has gone bullish before the Ichimoku indicator revealed it, credits to the RSI that gives us early signal. The observation above shows the efficiency of Ichimoku used with the RSI.
6. Conclusion
In conclusion, the Ichimoku indicator is an All-in-One indicator that identifies the trend, supports and resistance, price movements at different periods and more. With its components, Tenkan Sen, Kijun Sen, Senkou Span A, Senkou Span B and Chikou Span, serving the purpose of giving various indications to be utilized by analyst to making a trading decision.
Although, the Ichimoku indicator can be used on its own but using it with the RSI makes it more effective and its effectiveness was shown in a section in this article. Thanks to professor @kouba01 for this wonderful lecture. Thank you, all.
Cc: @kouba01
Written by;
@fredquantum
Dear @fredquantum
Thank you for participating in Steemit Crypto Academy Season 03 and making efforts to complete the homework task. You got 10/10 Grade Points according to the following Scale;
Key Notes:
We appreciate your efforts in Crypto academy and look forward for your next homework tasks.
Regards
@cryptokraze
Thanks for the review professor @cryptokraze. I will take the suggestion into account and work by it subsequently, thank you once again.
Great content with more solid details.
My question is when do we change Ichimoku's default parameters?
and Is the Indicator really useful?
📣📣📣 PrivacySwap Helps Bring Traditional Investors into the Crypto DEFI Space
🚨🚨🚨 Discuss, have fun, and let the potential of $PRV blast on the whole universe.
💥💥💥 EASY! How to invest smartly & securely in a DeFi project 💥💥💥
Click this link for more:
📌📌📌 https://bit.ly/freecrypto_class
📣📣📣 Discuss, have fun, and let the potential of $PRV blast on the whole universe.
✔️ Farming, Staking, & Vaults
#vault #PrivacyVault #BSC #APR #Privacy $PRV #Finance #blockchain #crypto #cryptocurrency #FreeClass

This is inappropriate!