Steemit Crypto Academy | Season 2: week 7 - The Swing trading style/ Por @franklin.tsosa
.jpg)
Greetings and a big hug to the entire community and people who make life in this prestigious academy, which week after week, allows us to obtain learning tools for this world of cryptocurrencies. Professor @yohan2on I want to congratulate you on this assignment, which will allow us to do a technical analysis when carrying out a cryptocurrency transaction. I want to mention that I am relatively new to this wide world of crypto. I hope through my interpretation of the class that I can do the teacher's homework correctly. Next we will answer the following questions:
-A Crypto asset pair.
-What's your Entry and exit strategy?
-Multiple time frame analysis
-Candlestick analysis and use of other relevant supporting indicators for your trade decision.
-Trade management ( Setting stop loss, trailing stop and take profit).
Swing Trading, as we all know, is a form of trading that is used by people who want to invest in the market in the medium or long term. The main purpose of this method is to take advantage of the movements or oscillations of the market by carrying out open operations for one or several weeks. But what is the result that is sought by means of this method? It is clear that it is to make movements in the market, that is, to look for daily patterns in charts in this case of a cryptocurrency and through an empirical study to obtain gains in the movements that can be made daily.
It is difficult to define a style in the world of Swing trading because there are countless that you can use in this study, where the search for the importance of where to locate your support and resistance levels prevails because there it eradicates the calculation of when the trend can be return bearish or otherwise an uptrend that exceeds your take profit calculations. Let us remember that the support and resistances are the minimum and maximum prices that a financial asset has reached over time.
It is logical to think today the market does not move in a straight way, if not in a staggered way or simply recognizing that the trends from one day to the next can change its inclination drastically. That is why the best way to combat an unstable economy is to apply this type of trading.

-In which cryptocurrency will I apply my trading study plan?
The currency chosen to carry out this commercial study was the cardano (ADA) which was launched in 2017 by Charles Hoskinson, one of the eight founders of Ethereum. Cardano is a platform that 4 years after its launch has had positive growth, being its ADA token, which has become the sixth largest cryptocurrency by market capitalization.

As for the technical analysis that I will develop next, I will use the work tool tradingview which will allow me to perform the financial visualization and has it within its tools for operations Binance. Binance is a platform that has the necessary tools and data to perform queries through basic price charts or to draw complex scatter symbols with a retrospective analysis of overlay strategies which will guide me in my decision making for the cryptocurrency. Cardano.
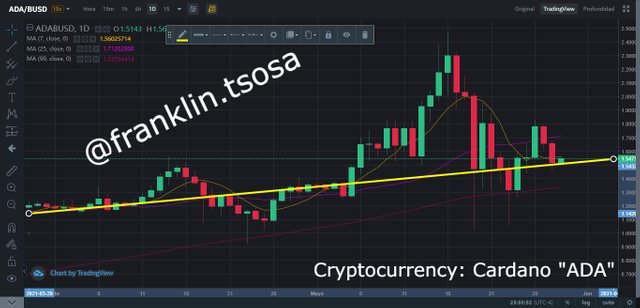
The following image to present shows the movement graph of the CARDANO cryptocurrency (ABA) in a period of time established by me from 03/28/2021 to 05/29/2021 in which I inquire about the first indicators of knowledge in relation to to the movement of the crypto, where we can clearly realize that it is in an upward projection along the path shown in the image, despite the fact that in all that time period in some movements of the graph it broke its resistance zone in Bearish direction, in March 2021 the CARDANO (ADA) was quoted at a price of $ 1.19, and its price was quoted today, May 29, 2021, it is $ 1.52.
A profit margin of $ 0.33 (bullish projection on the monthly chart).The following image to present shows the movement graph of the CARDANO cryptocurrency (ADA) in a period of time established by me from 03/28/2021 to 05/29/2021 in which I inquire into the first indicators of knowledge Regarding the movement of the crypto, where we can clearly realize it is in an upward projection throughout the route shown in the image, despite the fact that in all that period of time in some movements of the graph it broke its resistance zone In a bearish direction, on March 29 2021, the CARDANO (ADA) was at a price of $ 1.19, and its price was quoted today, May 29, 2021, at $ 1.52. A profit margin of $ 0.33 (bullish projection on the monthly chart).
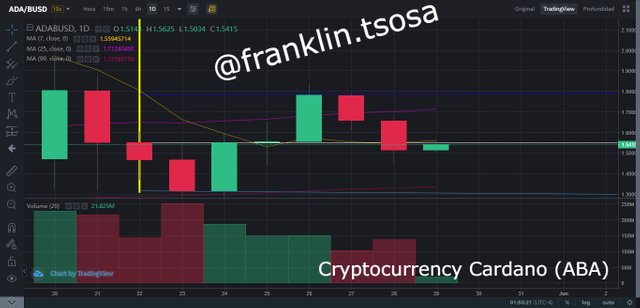
For the technical analysis of this graph, the following clarifications are made:
-On May 22, it is marked with a yellow line (beginning of the cycle to be evaluated).
-White line traces the value range of the coin ($ 1.51).
-blue line traces the historical maximum of the crypto in that cycle ($ 1.80).
-Beis line traces the range of loss in its support zone generating a value for loss of ($ 0.50) in its downward movement.
It is clearly observed that in the evaluated period of the 7-day chart of the crypto Cardano (ADA) three candles in a row are observed in a downward movement, being its resistance zone and then when the market changes to generate its rise. I see very difficult with the staggered movements of trajectory in the cryptocurrency market that gets to be valued again at its historical minimum values of two months ago ($ 1.30), in addition to ending the cycle in an upward trend, which translates to us That the price can continue to increase, being able to equal its historical maximum of ($ 2.44) on May 15, 2021. Definitively, resistance becomes support in the case of this crypto.
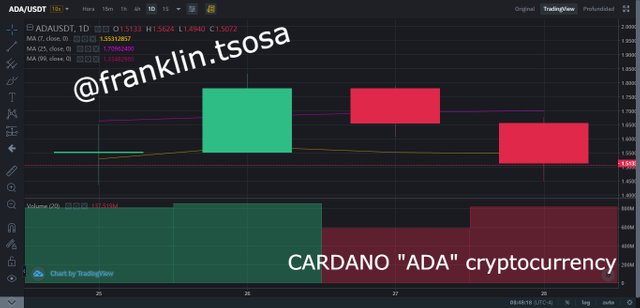
Already in this 4-hour cycle, my hypothesis is further reaffirmed, according to the analysis raised, it is in a corrective zone since it is normal that there is no movement in the market already in the morning of today. In this cycle I refer to a volume of 703.741.902.79 being the minimum in 24 hours of $ 1.50 and the maximum of $ 1.59 where despite the graph showing a downward trend, you can reverse the trend at any time reason why I will verify the momentum Using Moving Average Divergence / Convergence (MACD) to verify the signal line crossing since it is probable that in an hour or minutes you will show an inversion in V.
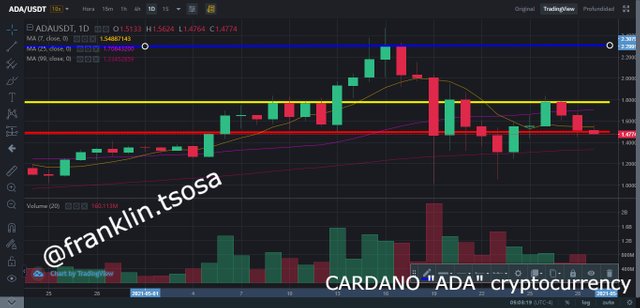
-My stop loss = $ 1.49 (red line)
-Take profit = $ 1.80 (yellow line)
-Trailing stop loss = $ 2.40 (blue line)
Being realistic despite some technical tools that I use to better understand the movement of the CARDANO cryptocurrency, where it is also an empirical reasoning because due to all the experience lived through the study of each cycle, it generates a rational idea of towards What direction would the cryptocurrency take. Remember that in trading there is no absolute truth about what can actually happen in a trade.
Even so, based on everything explained above and remembering the teacher's class, if the aforementioned cryptocurrency reaches the market value of $ 1.80 I would carry out the buy operation, placing my stop loss at a limit of $ 1.49 and the take profit at $ 2.40. An option that undoubtedly with the stability shown of the crypto, should be generated in the market, thus obtaining a profit margin of $ 0.60 cents of a dollar and thus controlling the loss in the opposite case of a downtrend. Without a doubt, in the short or medium term, said operation, explained above, seems feasible, since CARDANO is called to consolidate itself as one of the most stable cryptocurrencies. We will see that it will not show time
After all the way the journey in this class, there remains a significant learning, this variant of trading being a not so complex strategy when carrying out a short-term study of a movement of a crypto which can give you objective results for Take advantage of market changes taking as great importance knowing how to understand the support and resistance lines that are generated in the crypto cycle to be analyzed, because in those areas in particular it is where the uptrend processes can be reversed or break those supports thus generating closures below a support zone.
I also have to be sincere professor and say that a person like me starting out and without any capital is difficult to undertake in this world of trading, where most of the time the results of random operations reign due to the high level of difficulties that today It has to be successful in an operation, due to all the social and economic factors that cause declines in the world market. Without more to say, very grateful for your assignment and happy to be able to find the opportunity in a task to initiate a deeper into this virtual world of assets. Greetings a big hug I hope to receive your qualification soon.

Hi @franklin.tsosa
Thanks for participating in the Steemit Crypto Academy
Feedback
You lacked a trading plan. The stop loss and trailing stop were placed in wrong positions. You, therefore, did not showcase proper trade management. Generally, this poorly done. You need to take time and learn about the basics of trading.
Homework task
2.5
Thank you teacher, you are absolutely right, I feel insecure about this ... teacher, some page that you can recommend to me so that I can get started.