On-chain Metrics(Part-2)- Steemit Crypto Academy- S4W3- Homework Post for @sapwood


(1) What is the difference between Realized Cap & Market Cap, How do you calculate Realized Cap in UTXO accounting structures? Explain with examples?
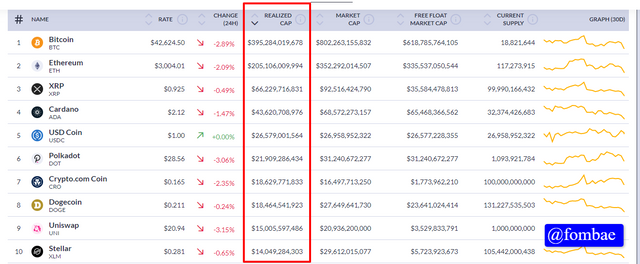
- Realized Cap
The main reason behind the creation of Realized Cap was the fact that the Market cap was seen as an empty metric when applied to cryptocurrencies. Realized Capitalization came about in 2018 and is calculating the value of each coin at the price it was last moved on-chain. Realized Cap is the total amount of a coin in value based on the closing price of the day. That is the sum of all the native units of the asset when it was last moved. When looking at Realized Cap at least for the UTXO chain, we need to design goals such as:
- A single Order of Magnitude should not deviate from the Market Cap
- Maximize generalizability
- De-emphasize lost coins
 Screentshot Coinmetrics
- Realized Cap can be a method to :
-Reduces the contemporary impact of long-lost coins
-Doesn’t significantly deviate from the Market cap
-Doesn't require human intervention(it is automatic)
-It is trivially generalizable to UTXO chains,
Realized Cap some fractions of the native asset tend to get lost and go unclaimed. When this happens, the unclaimed asset is assumed to be completely lost and out of circulation
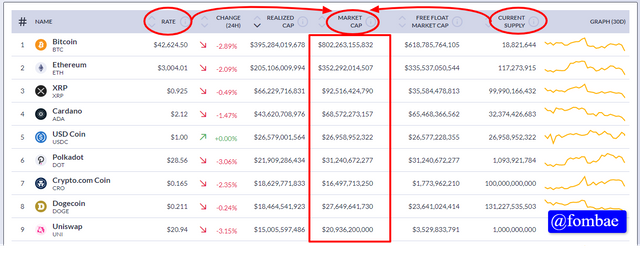
- Market Cap
Market Cap can simply be seen as the total supply of a native asset multiple by the current market prices. Like I mentioned above with Realized Cap, some percentages of the asset get lost. With Market Cap, the value of all the assets ever minded is brought together and calculated using the last current market price. We can see with Market Cap, emphasizes pay to the unclaimed asset even though it is characterized by assumptions. From the chart below, we can notice that our Market Cap is gotten from the current supply and the current price.
 Screentshot Coinmetrics
At any particular time, supply is fixed and changes as the price changes depending on the demand. In summary, market Cap is a snapshot of the current supply and current price at that particular time. Time is important because the next time frame will be a different snapshot.
- Calculation Of Realized Capital In UTXO Accounting Structures With Examples.
I will calculate the Realized Cap by using a Market Cap of a UTXO currency. A practical example with a total of five(UTXO) moves.
| Date(last UTXO Moves) | No of UTXO | Current Price of Date($) | Realized Cap (No of UTXO*Price of Date)($) |
|---|---|---|---|
| 19 Oct 2016 | 3 | 5 | 15 |
| 30 Nov 2016 | 2 | 10 | 20 |
| 10 Nov 2016 | 1 | 15 | 15 |
| Total | 5 | - | 50 |
  Realized Cap On  10th Nov 2016
   => $ 15 + $ 20 + $ 15 = $ 50
  Market Cap On  10th Nov 2016
    => 5 * 15  =  $ 75
We can see a significant difference in the values between the Realized cap and Market cap on the 10 Nov 2016.
(2) Consider the on-chain metrics-- Realized Cap, Market Cap, MVRV Ratio, etc, from any reliable source(Santiment, Glassnode, etc), and create a fundamental analysis model for any UTXO based crypto, e.g. BTC, LTC [create a model for both short-term(up to 3 months) & long-term(more than a year) & compare] and determine the price trend/predict the market (or correlate the data with the price trend)w.r.t. the on-chain metrics? Examples/Analysis/Screenshot?
- Realized Cap.
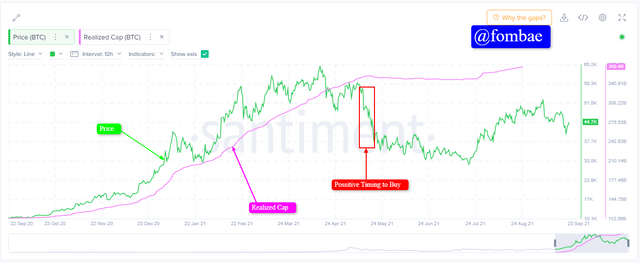
Let look at short-term and long-term for Realized Cap, we will be using on-chain matric platform Santiment.
 Screentshot Santiment
Looking at the chart above, we see that the realized cap has its path and is not necessarily moving with the price. Both price and realized cap cross each other. When price crosses and creating a dip downward movement, indicate possible timing for investors to invest.
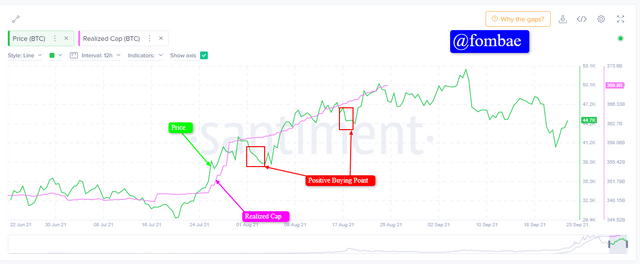
 Screentshot Santiment
From the chart, we are having a visible difference between the prince and the Realized cap. As I mentioned for the short-term, the right moment to buy is when we have a dip in the price. On 14 May 2021, we can see the Realized cap above the price level as the price is moving downward, indicating the right moment for investors to invest.
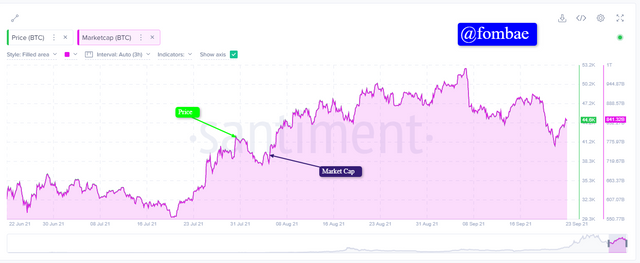
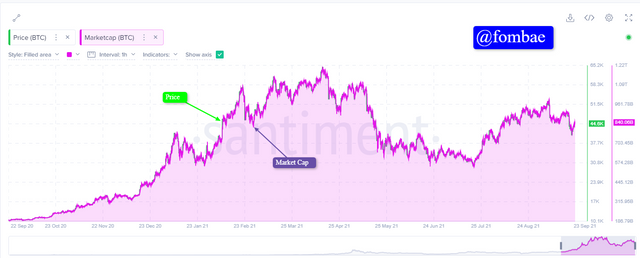
- Market Cap.
I will be using on-chain matric platform Santimentto analyze short-term and long-term for Market Cap.
 Screentshot Santiment
From the chart, we can see that the BTC price is moving alongside the Market capital. It is a result of the movements of the market cap and the price in the market. If the price level moves above the market cap, which is a possible signal for a bearish trend and not the best moment to buy.
 Screentshot Santiment
From the chart, the movement is almost the same as that of the short team. In the long term, we can have a visible view of when to enter or exit the market. As I mentioned above, the right signal to buy should be when the market cap moves above the price.
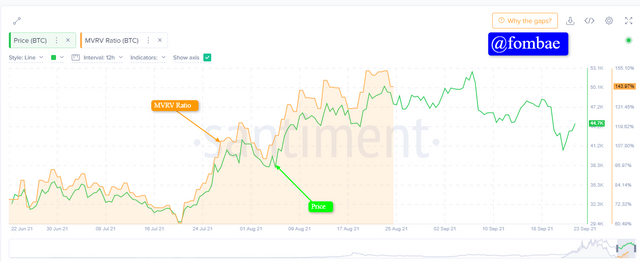
- Market Value to Realized Value(MVRV)
 Screentshot Santiment
From the chart, the MVRV ratio is mostly above the price level and can be used to anticipate a market trend. If the MVRV ratio moves below the price level, a possible buying point is triggered in the market.
 Screentshot Santiment
As I mentioned for the short-term analysis, the movement of the MVRV ratio can help detect a future market trend. When the MVRV ratio moves below the price it is a strong signal for investors to buy.
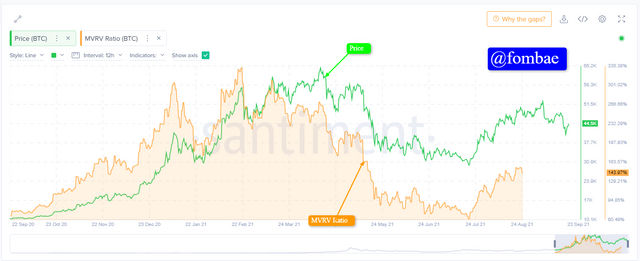
(3) Is MVRV ratio useful in predict a trend and take a position? How reliable are the upper threshold and lower threshold of the MVRV ratio and what does it signify? Under what condition the Realized cap will produce a steep downtrend? Explain with Examples/Screenshot?
- Is MVRV ratio useful in predict a trend and take a position?
From the definition of the MVRV ratio from the course. We conclude that when the MVRV ratio is above the price. The trader should be anticipating an exit point in the market. On the other hand, when the MVRV ratio is below the price, the trader should be anticipating an entry point in the market. This conclusion seems confusing when looking at a long-term MVRV ratio chart. For example.
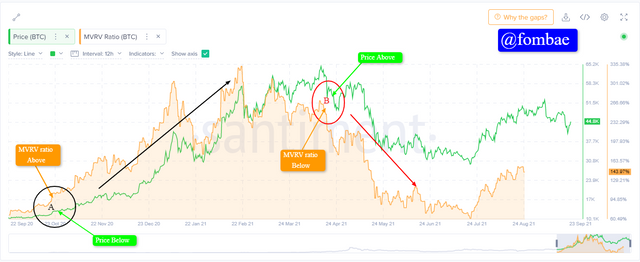 Screentshot Santiment
At point A, we have the MVRV ratio above the price, meaning it is a possible selling point that will mean getting out of the market. From the chart, we see the price in an upward trend, and which means that staying in the market will yield us more profit with the MVRV ratio above the price line. It becomes very confusing to know when to exit or HOLD in the market.
Another confusing moment on the chart is point B, where we have the MVRV ratio below the price. Theoretically, this will mean that the investor should be anticipating a possible entry point into the market. Same time on the chart we can see our price falling making it difficult to decide to buy or not.
MVRV ratio analysis is not a perfect indicator for an investor who is new to reading charts, the whole stuff gets confusing both in the upward direction movement and downward direction movement.
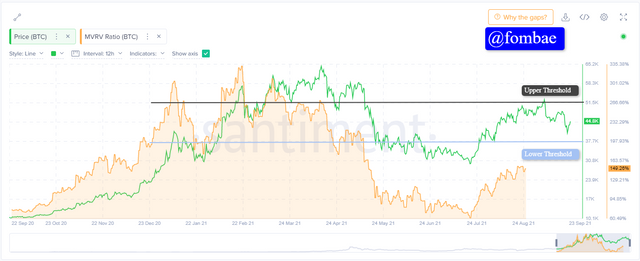
- How reliable are the upper threshold and lower threshold of the MVRV ratio and what does it signify?
Upper Threshold is when the market is in an upward trend and strictly passes the resistance level while the lower threshold is when the market is in a downward trend and strictly passes the support level. We try to apply the resistance and support level to the MVRV ratio chart.
 Screentshot Santiment
On the chart above, we have two lines that represent our Upper and Lower Threshold in the market. Set the Upper Threshold at 51.5K and the Lower Threshold at 37.7K. Following this chart present, the trader should be looking at selling to make a profit if the price hints at the lower threshold point or HODL to make more profit if the upper threshold.
- Under what condition the Realized cap will produce a steep downtrend?
No trader is ready to take a loss in trading. So when the market is in an upward trend, investors quickly sell to make a profit. This action in the market influences the movement of the Realized Cap.
So when investors turn to HODL a coin due to low price in the market, or buy due to low price, and sell when the market price is in an upward trend. These activities on the market turn to affect the Realized Cap, as more of the coin is sold out the Realised Cap can go into a steep downward trend because of an increasing number of UTXO movements.
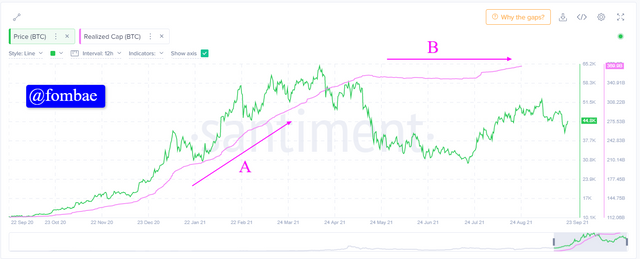 Screentshot Santiment
We can notice, as the price was in an upward movement, the realized cap was in an upward trend. This happened because in HoDL and buying BTC, that moment the price started a downward trend with investors selling. The Realized cap stops the upward trend and stays in an almost neutral trend.
Conclusion.
From my point of view, the On-chain metric is not a starting point for investors, it has been a whole learning process for me. Good thing I got to understand how the Realized Cap and Market Cap are achieved. As I mentioned before, reading MVRV ratio charts is very complicated and confusing. I propose that an investor should apply other technical analyses before making a final decision in buying or selling in the market. Long-term positions are the perfect position to make use of the MVRV ratio. Adding to that, using the upper threshold and lower threshold can be of great help. Thanks @sapwood
Hello have a good day sir.
Please verify my post.
https://steemit.com/hive-172186/@akram58/achievement-1-introduction-myself-by-akram58