Crypto Academy Week 14 - Homework Post for [Crypto Professor @kouba01]

- What is the MACD indicator simply? Is the MACD Indicator Good for Trading Cryptocurrencies? Which is better, MACD or RSI?
MACD in full means the moving average convergence/divergence indicator. MACD is an oscillator used in trading trends by investors following the prices. MACD is made of two lines that oscillate across the chart without boundaries. Where these two lines cross each other, they produce an average system giving a trading signal. MACD respects the concept of bullish when it crosses over zero and bearish when it goes below zero.
MACD is new to me, but I categorically agree that MACD is good following the explanation giving by the professor on the four components. The MACD line, Signal line, Zero line, and Histogram line. To make a profit on the chart, every detail is important. With the presence of all this component, so much information is at the disposal of the investors. This information helps to guide the investor and minimize losses.
Both RSI and MACD are momentum oscillator indicators to measure trading trends on the crypto chart. Following the course of two weeks ago and that of this week, one significant difference is the fact that MACD has two lines(MACD line and Signal line). Adding the components to the MACD, give more information as I mentioned above. With more information, a high chance accurate trading signal is given. So having multiple signals from multiple technical indicators give MACD an edge over RSI.
- How to add the MACD indicator to the chart, what are its settings, and ways to benefit from them? (Screenshot required)
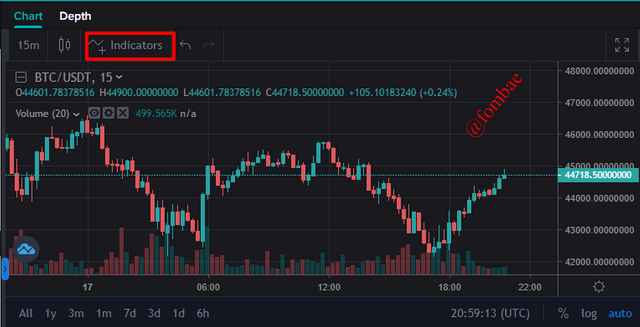
The screenshots are from my Poloniex exchange wallet
- Click the indicator
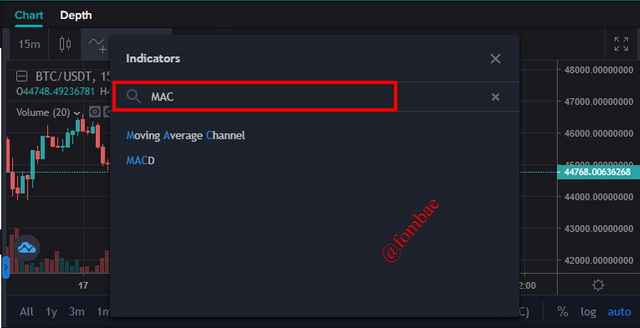
- Popup appears (search MACD)
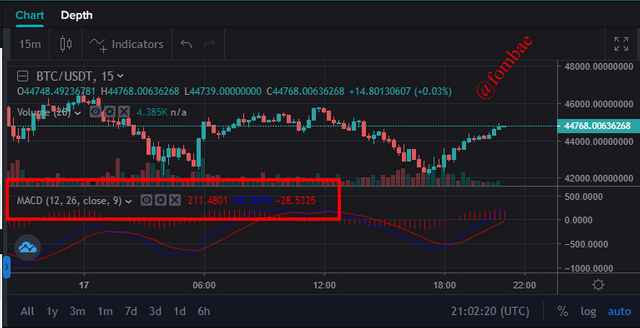
- You can go ahead to customize the different components of MACD
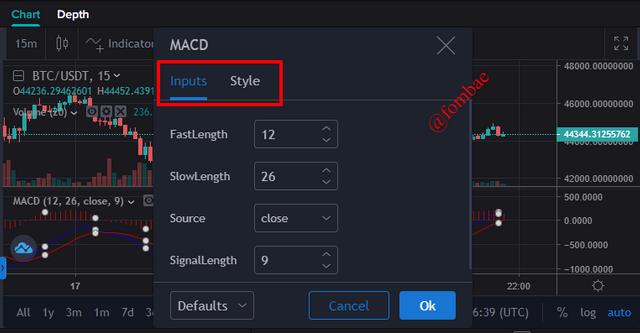
- Click the setting icon to make changes
- How to use MACD with crossing MACD line and signal line? And How to use the MACD with the crossing of the zero line?
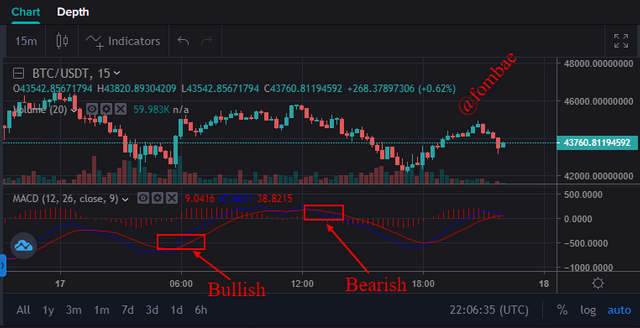
- When the MACD line moves further above the Signal line below the zero lines, the indicator is considered bullish. The same goes for when MACD moves further below the Signal line above the zero lines, the indicator is considered bearish.
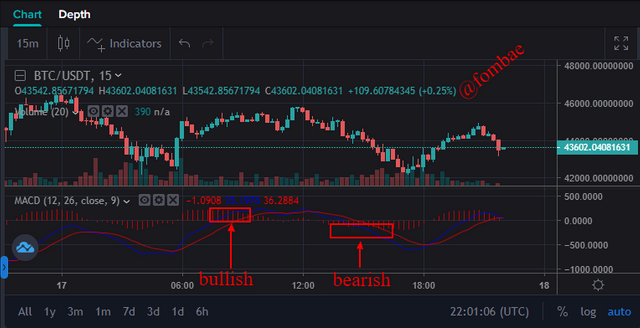
 MACD blue line and Signal red line
- Following the oscillation of the MACD, when the MACD lines move above the zero lines, it considers bullish, and below is considered bearish.
- How to detect a trend using the MACD? And how to filter out false signals? (Screenshot required)
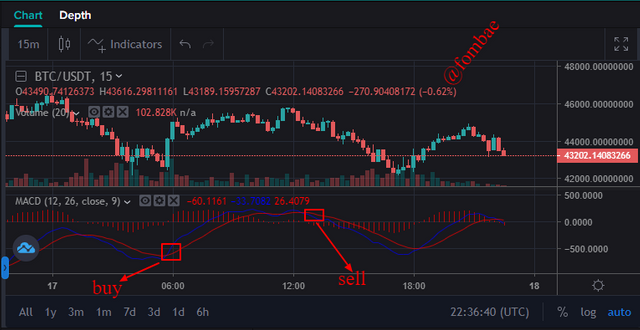
During trading, the MACD line and signal line keep crossing each other within the period. So movement like this can help investors detect trading trends. Like I mentioned above, you can make a strategic decision either below or above the zero lines. These movements between the MACD line and the signal line are important points to take notes of as they cross each other. The MACD line that moves above the signal line is a perfect indication to get into a trade. A perfect indication to back out of a trade can be when the MACD line has a strong fall below the signal line.
To filter out a signal to me, I will look at the strength of the fall or the raise. I believe that the stiffness of the angle can be of help, and applying more indicators can help.
- How can the MACD indicator be used to extract points or support and resistance levels on the chart? Use an example to explain the strategy. (Screenshot required)
To extract support and resistance level on the chart, you have to consider the movement of the MACD line, signal line, and histogram signal.
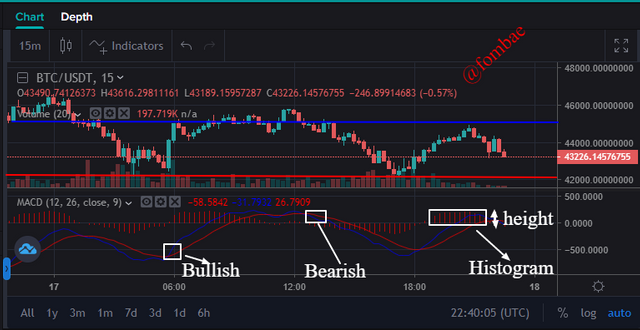
From the above screenshot, the movement of the MACD above the signal line (Bullish) indicates that I should start a trade. The nature of the curve show I go in for a short-term trade. In such a situation, it very important to apply the stop limit strategist. Next on my screenshot, the point where the MACD line starts falling below the signal line(Bearish). This just the best moments to sell given that you are doing short team trading, taking chance can lead to great loss. Lastly, on my screenshot, it the histogram which is directly on the zero lines. The histogram has a signal which can be easily followed alongside the movement of the MACD line. This move can help pick a support and resistance level on the chart. Noting the different heights along with the oscillation on the chart.
- Review the chart of any pair and present the various signals from the MACD. (Screenshot required)
Throughout this task, I have been working with BTC/USDT pairs.
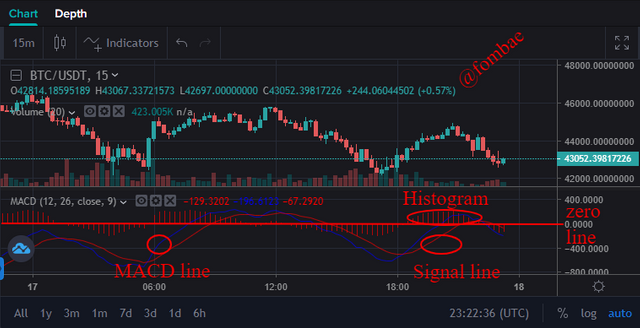
The blue oscillating line is the MACD line.
The Red oscillating line is the Signal line.
The Red straight line is the zero line.
The Red bars on and below the zero line is the histogram line.
Conclusion
This has been a long course moving from RSI some weeks ago to MACD. This week is an opportunity for me to understand some of these indicators. I have never known of such indicators, neither have I ever click such options. I have no only know but understood the movement of the MACD line and Signal line between the zero lines.
cc: @kouba01
Hello @fombae,
Thank you for participating in the 6th Week Crypto Course in its second season and for your efforts to complete the suggested tasks, you deserve a 6/10 rating, according to the following scale:
My review :
Acceptable work in which you tried to answer the questions using the set of information available to you. It remains that you did not delve deeper into analyzing some points, especially in the last question, where you did not address the change in price movement based on the MACD signals.
Thanks again for your effort, and we look forward to reading your next work.
Sincerely,@kouba01
Oh yeah that right, Thanks for this course. it has really enlightened me on the different indicators.
Thanks again for taking your time to review my work. Courage Sir