UNDERSTANDING TRENDS | CRYPTO ACADEMY | S5W1 - HOMEWORK POST FOR @reminiscence01
It's feel good to partake in the new season again, I will be dropping my homework post on understanding trends by professor @reminiscence01.

DESIGNED ON POSTERMYWALL.COM
1A. WHAT DO YOU UNDERSTAND BY A TRENDING MARKET ?
B. WHAT IS A BULLISH AND A BEARISH TREND ? (ORIGINAL SCREENSHOT NEEDED FROM YOUR CHART)
2 EXPLAIN THE FOLLOWING TREND IDENTIFICATION AND GIVE AN EXAMPLE OF EACH OF THEM. (ORIGINAL SCREENSHOT NEEDED FROM YOUR CHART)
DO THIS FOR A BULLISH AND A BEARISH TREND
        I. MARKET STRUCTURE
        ii. TRENDLINES
3 EXPLAIN TREND CONTINUATION AND HOW TO SPOT THEM USING MARKET STRUCTURE AND TRENDLINES. (SCREENSHOT NEEDED). DO THIS FOR BOTH BULLISH AND BEARISH TREND.
4 PICK UP ANY CRYPTO - ASSET CHART AND ANSWER THE FOLLOWING QUESTIONS
I. IS THE MARKET TRENDING ?
II. WHAT IS THE CURRENT MARKET TREND ?
(USE THE CHART TO BACK UP YOUR ANSWERS)

Trends are familiar market situation to every crypto/Forex/stock trader. Be it on the 5mins/15mins/1hr or 4hrs time frame, there is always a conformity in the movement of the candlesticks/price i.e these candles (either bullish or bearish) takes over the market structure creating a similar pattern and moving in similar direction. Traders who make use of technical analysis to carry out or pick their trades always make use of the trending market because to them it is an indisposable tool. It is believed that once a trader can be able to discern correctly the trend of the current market structure, such a trader will no doubt make good returns.
A trending market situation provides easy detection of spots where to place either a 'BUY' trade or a 'SELL' trade.
Notable trends that could be observed on the trading charts are 'Higher Highs' and 'Higher Lows' for the bullish trend (uptrend) and 'Lower Lows' and 'Lower Highs' for the bearish trend (downward trend) as well as the sideway trend.
However, it is to be noted that one of the primary reasons why there is usually a trend formation is the 'liquidity' of the currency or crypto coin we are trading, meaning that the more liquid a particular crypto/currency pair is, the more volatile they become and in return, the higher the chances of experiencing a massive movement of price in the same direction.
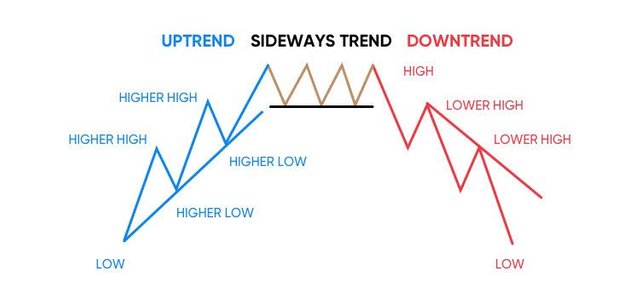
Image Source
The image above depicts the various trends that can be seen or observed on the trading charts.
The bullish and bearish trend are two of the most widely used trends by technical analyst on the trading chart. Let's take a deeper look at the bullish trend.
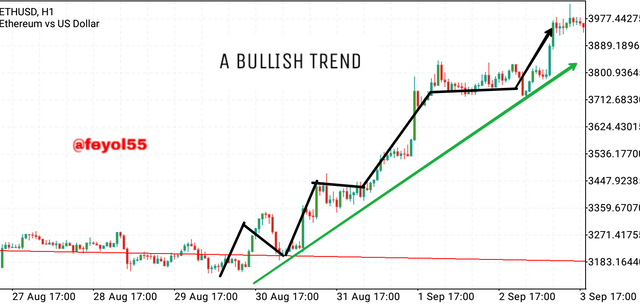
When a market is in a Bullish trend, it means that the prices of stocks/assests/crypto are rising, this trend could last for hours, days, months and possibly even years. This trend can be seen in some crypto pairs on the trading chart. Some notable factors that contribute to a Bullish Trend is the strengthening of the economy (increase in GDP), increase in demand for stock, increase in purchase or demand of crypto coin etc Traders who will want to profit from a bull trend will place their trade at some specific points majorly at the 'Higher highs' or the 'higher lows'. However, traders should be careful of a retracement in trend as no trend last forever.
ORIGINAL SCREENSHOT TAKEN ON MT5 APP
As we can see above, the screenshot shows a notable bullish trend/uptrend on the ETH/USD market (precisely on the 1HR Time frame).
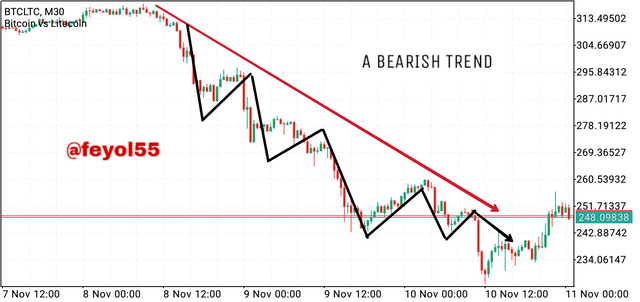
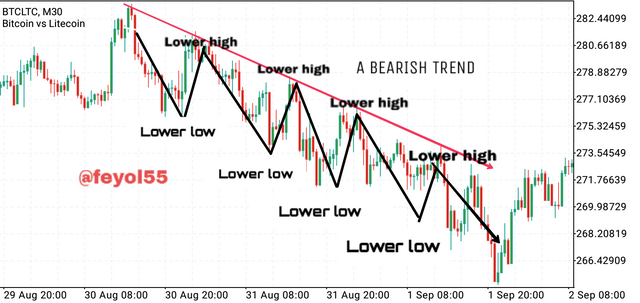
When a market is in a bearish trend (downward trend) this connotes that there is a fall or decrease in the prices of stocks/assets/crypto. This is an indication that the sellers are stronger and are actively dictating the direction of the market. Such trends could last for hours, mins, or even days depending on when there is a correction or retracement in price. However, some factors like recession of the economy, spike in unemployment, dumping of crypto coins by holders, decrease in GDP, sharp decrease in demand or purchase of a crypto coin/asset can cause or result in bearish trend on the market. Traders who would want to take advantage of this trend should place their trade at some specific entry points which are the 'Lower lows' and the 'Lower Highs'. The trader needs to get his analysis correct and be able to discern when there is a retracement so that he/she won't run at a loss after placing his trade in line with the current trend.
ORIGINAL SCREENSHOT TAKEN FROM MT5 APP
From the screenshot above, we can see a bearish trend/downward trend in the 30mins trading chart of the BTC/LTC crypto pair.
    I. MARKET STRUCTURE
    II. TRENDLINE
The market structure depicts the current state of the trading market be it Forex, stock or crypto. It's a representation of price action of the stock in trade at a particular period of time. A good reading of the candlestick pattern combined with the market structure helps to give traders a good entry points which in turn give good return. Notable market structures on a trading trading chart includes : bullish trend, bearish trend, ranging market, support and resistance, head and shoulder, swing highs and lows etc.
For the sake of this Homework, I will be discussing on the bullish trend and the bearish trend market structure.
As I stated earlier, the bullish trend is one of the notable market structure that we can see on the trading chart. This market structure is characterised by an upward movement of prices, in this scenario the buyers are actively dictating the pace and Pattern of the market state.
Take a look at the screenshot below.
ORIGINAL SCREENSHOT TAKEN FROM MT5 APP
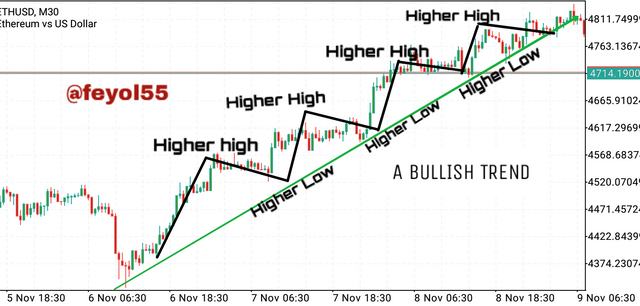
From the screenshot above, we can see that the current market state is in an upward trend which is the bullish trend.
The higher highs simply represents new highs on the bullish trend, this new high is normally higher than the previous High, hence it is referred to as Higher - high, the buyers which are actively stronger are responsible for the creation of Higher Highs and For this uptrend to be continued, the new high points needs to be higher than the previous high.
Let's talk about the higher Lows as seen in the screenshot.
The Higher Lows are created as a result of retracement in the market price. This retracement is characterised by a new 'Low' point which is higher than the previous 'Low'. The retracement is needed to keep the trend moving.
Using these two scenerios, the trader can keep trading along the trend until price fails to create a new high, this automatically indicates that the buyers are getting weaker hence they are unable to push the price up further.
The bearish trend market structure which is also known as the downward trend is characterised by a notable downward movement of prices, in this scenario, the sellers are actively dictating the movement of prices or the pattern of the market state.
Take a look at the screenshot below
ORIGINAL SCREENSHOT TAKEN FROM MT5 APP
From the screenshot above, we can see that the current market state is in a Bearish trend.
The 'Lower Lows' simply represent new lows that helps keep the bearish trend, this new lows are usually lower than the previous low, hence, it is referred to as 'Lower Lows'. The sellers which are more active and stronger in this state are responsible for the creation of the Lower-Lows. For this trend to continue, the new low needs to be lower than the previous low.
Let's talk about the 'Lower High'
Similarly to the uptrend, the 'Lower Highs' are formed as a result of retracement in market price. This retracement is characterised by a 'High point' which is lower than the previous High.
Using this entry points, the trader can keep trading in line with the trend until price fails to create a new 'Low'. This indicates that the sellers are getting weaker hence, they are unable to push the price down further.
Trendlines are noticeable lines that are usually drawn on trading charts to help traders identify or pin-point the direction of the market price. It is a straight line that is drawn to connect two or more high points as in the case for a bearish trend and also a straight line can be drawn to connect two or more Low points as in the case for a Bullish trend.
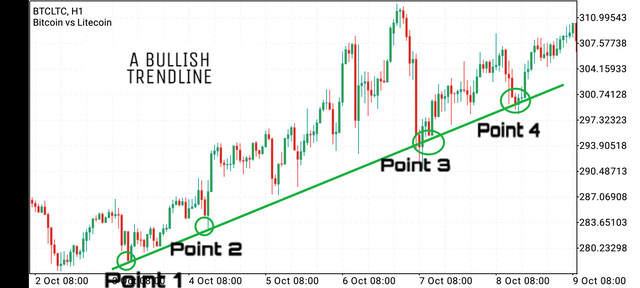
ORIGINAL SCREENSHOT TAKEN FROM MT5 APP
As seen in the screenshot above, the market structure indicates an uptrend/Bullish trend, the Trendline just sit below the price action and it connects the bottom (low points) of the trading crypto pair, this invariably means the prices is trading above the Trendline. Anytime price attempts to touch this trendline, it bounces back, but once there is a breakout on this trendline, it is advisable not to enter any trade because the trend is no longer valid.
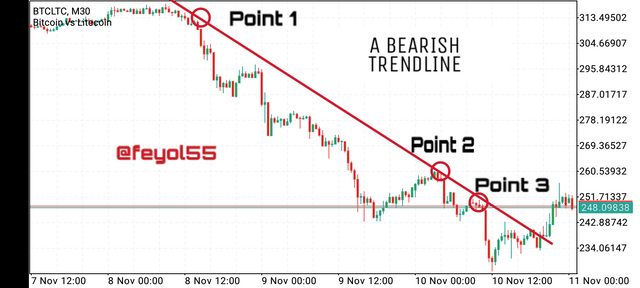
ORIGINAL SCREENSHOT TAKEN FROM MT5 APP
As seen in the screenshot above, the market structure indicates a downward/bearish trend, in this scenerio, the trendline just rest above the price action and it connects the top (High posts) of the trading crypto pairs, this means that the price is trading below the trendline and any attempt by the price to touch the trendline is usually resisted as it bounces back. However, once there is a noticeable breakout on this trendline, it is advisable not to enter any trade anymore because the trend has been rendered invalid.
Trend continuation are market patterns that traders watch out for before they enter a trade. Trend continuation is characterised by continuing movement of market in same direction for a particular period of time. Examples of Trend continuation are upward trend also known as the Bullish Trend and the downward trend also known as the bearish trend. However, it's good to note that, continuation of trend may be rendered invalid by price reversal or retracement. Traders can however spot a trend continuation be it an uptrend using the market structure and Trendlines. I will be discussing more on bullish/bearish Trend.
For Bullish trend, the following vital points should be seriously taken note to ensure a Bullish trend continuation.
- Formation of a Higher Highs on the trading chart.
- Formation of a Higher Low on the trading chart
- Retracement of prices when there is a new 'LOW' point.
- The new Low points formed on the chart shouldn't be lower than the previous low
- The new high point also formed on the trend should be higher than the previous high
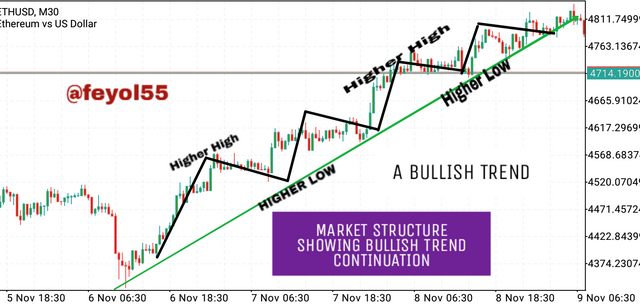
ORIGINAL SCREENSHOT TAKEN FROM MT5 APP
Looking at the screenshot above, we can see the new Low point and the new High point formed along the trend
For a Bearish Trend, the following key events must be seriously considered to spot a trend continuation.
- Formation of a Lower lows in the trading chart.
- Formation of a lower high on the trading chart.
- Retracement of prices when there is a new 'High' point.
- This implies that the new Low point must be lower than the previous Low.
- The new High point must be lower than the previous high.
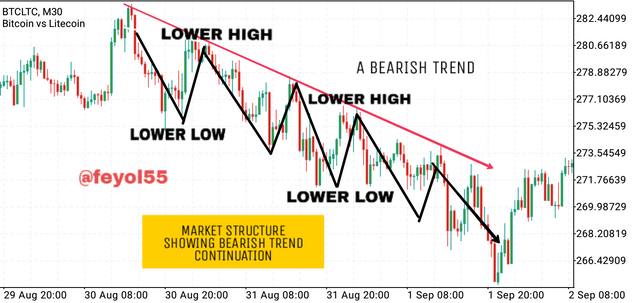
ORIGINAL SCREENSHOT TAKEN FROM MT5 APP
The pic above depicts how the market structure should look for a bearish trend continuation to take place.
After a Trendline has been drawn, it is important to note that for a trend to continue in a similar direction, this Trendline must remain valid, i.e there should be no breakout of the trend. Let's see how this trendline can help spot a bullish and bearish trend continuation.
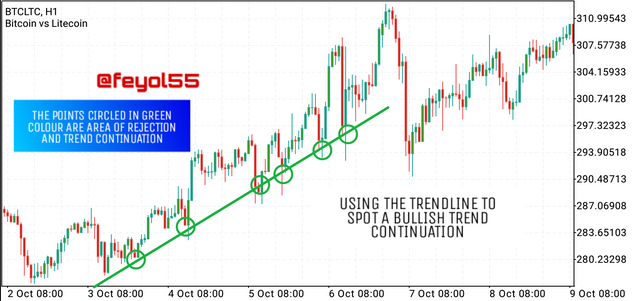
ORIGINAL SCREENSHOT TAKEN FROM MT5 APP
As we can see above from the screenshot, attempts of a breakout by the price was resisted by the buyers at the zones circled 'green' resulting in rejection and trend continuation. This is a good way to spot bullish trend continuation using the trendline.
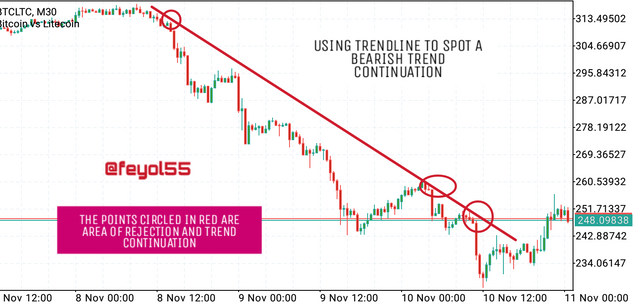
ORIGINAL SCREENSHOT TAKEN FROM MT5 APP
As we can see from the screenshot above, attempts of a breakout in prices was resisted by the strong sellers resulting in rejection (at the zones marked red) and continuation of the trend. This is a good way to spot a bearish trend continuation.
I. IS THE MARKET TRENDING ?
II. WHAT IS THE CURRENT MARKET TREND ?
USE THE CHART TO BACK UP YOUR ANSWER.
Yes, looking at the market critically, one will notice that the general trend at this period of time is a BULLISH trend.
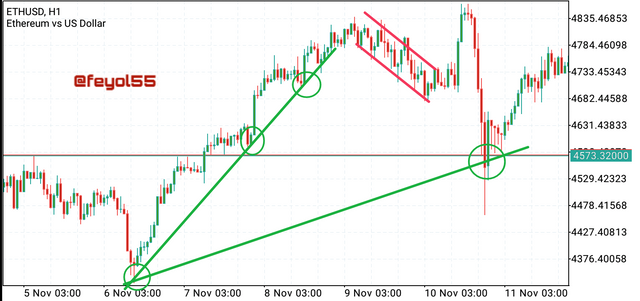
ORIGINAL SCREENSHOT TAKEN FROM MT5 APP
Screenshot of ETH/USD on the 1HR time frame.
From the chart above, it could be observed that the general trend is an uptrend or bullish trend, the price kept pushing up and new Higher Highs and Higher Lows were created. At some point, the buyers became weak and the sellers took advantage for some brief period as seen on the chart, during this period the market went bearish which is a sort of retracement because the buyers couldn't create a new Higher High, but it didn't last long as the buyers came back stronger after the retracement and pushed the price further high.
From the chart we can see two noticeable bullish trendline, the price broke the first one but the sellers weren't strong enough to break the second trendline, hence the continuation of the bullish trend.
The study of trends before entrying trades is a good trading quality especially among technical analyst traders. Trends form a vital part of the market structure that helps to predict the current market state. I hope to build more on my knowledge as far as Trends are concerned.
However, this course by professor @reminiscence01 is really an eye opening one as it has given me more in-depth knowledge about the market structure and trendlines. Thanks !
Hello @feyol55, I’m glad you participated in the 1st week Season 5 of the Beginner’s class at the Steemit Crypto Academy. Your grades in this task are as follows:
Observations:
You could have moved your chart to the current date for this analysis.
Recommendation / Feedback:
Thank you for participating in this homework task.
Thank you professor @reminiscence01 for the assessment, I will work on your observation in my subsequent posts.
Hello professors
Cc: @steemcurator01
@steemcurator02
@reminiscence01
@sapwood
Pls this post will soon expire in few hours time and it has not been voted yet