SUPPORT AND RESISTANCE BREAKOUTS | CRYPTO ACADEMY | S6W3 | HOMEWORK POST FOR @pelon53
Good day steemians, it feels good to participate again in week 3. Today I will be posting my assignment on the topic 'SUPPORT AND RESISTANCE BREAKOUTS' taught by professor @pelon53.
.jpg)
IMAGE DESIGNED ON POSTERMYWALL.COM
1.- Explain in detail the advantages of locating support and resistance on a chart before trading.
2.- Explain in your own words the breakout of support and resistance, show screenshots for the breakout of a resistance, use another indicator as a filter.
3.- Show and explain support breakout, use additional indicator as filter, show screenshots.
4.- Explain what a false breakout is and how to avoid trading at that time. Show screenshots.
5.- On a demo account, execute a trade when there is a resistance breakout, do your analysis. Screenshots are required.
6.- In a demo account, execute a trade when there is a support break, do your analysis. Screenshots are required.
7.- Conclusion

There are a lot of strategies one can use to execute trades on the crypto market. Among this strategies, we have the support and resistance strategy which I will be talking about. Before I talk about the advantages of locating this two zones on the chart, I will like to briefly talk on both of them.
SUPPORT ZONES
A support zone is usually formed on a trading chart when price move downward or Bearish but pauses as a result of increase in demand resulting in buying pressure from the buyers. This causes a support level to be formed. Two things can happen at this zone, price can either bounce back forming a Bullish reversal or price can break this zone and continue in a downtrend momentum until it hits the next support turned resistance.
Let's take a look at the image below which illustrates this zone.
RESISTANCE ZONE
This zone is a sharp contrast to the support zone. A resistance zone is usually formed on a trading chart when price move upward or bullish but pauses as result of increase in supply resulting in selling pressure from the sellers. This causes a resistance level to be formed. Two things can happen at this zone, price can either bounce back forming a bearish reversal or price can break this zone and continue in an upward momentum until it hits the next resistance now turned support.
Let's take a look at the image below which illustrates this zone
Now, having established what these two zones are, let's take a look at the advantages of locating this two zones on a chart before trading.
Using the support and resistance zone, a trader can easily have an idea of the market price movement of an asset. Most times when price violates these zones, a new support and resistance level will be formed.
Using the support and resistance, a trader can identify an entry spot which could be either a BUY ENTRY or SELL ENTRY. Once any of these two entries has been identified, a trader can place his trade
Support and Resistance makes it easy for a trader to identify market trends (Bullish/Bearish) by so doing, the trader can make profitable trading decisions.
The concept of the Support and Resistance also makes it easy for a trader to place a stop loss at this zones hence ensuring that the trader is using good risk management.
In combination with a good indicator, a trader can develop a profitable trading strategy using this support and resistance breakout trading concept.
As explained earlier, Support and Resistance zones are sensitive zones on the trading chart where a trader can examine the next price movement. When price breaks a support zone, it is expected that price will go downtrend, where as, if price breaks a resistance zone, it is expected that price will go uptrend.
Let's take a look at the breakout at the Resistance zone.
BREAKOUT OF RESISTANCE
I'm going to be using two different charts to illustrate how to identify and explain the Resistance breakout.
Let's take a look at the first image below.
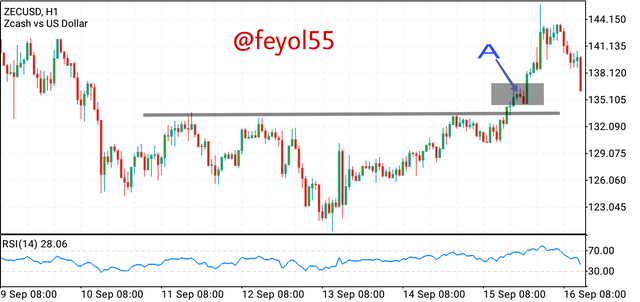
On this ZEC/USD chart above, we can observe that price gained momentum after a lot of buying pressure, price went up and broke the next resistance level as indicated on the chart, after price broke this resistance zone, the price pulled back a little to gain more momentum and follow the bullish trend. We can enter a BUY ENTRY at point A on the chart and our stop loss can be placed below the broken resistance area and also we can set our take profit at the next support level turned resistance.
I also used the RSI indicator as my filter, it further confirmed my BUY ENTRY as the RSI was at an overbought zone and it kept trading at this zone for some time.
Let's look at the 2nd image below
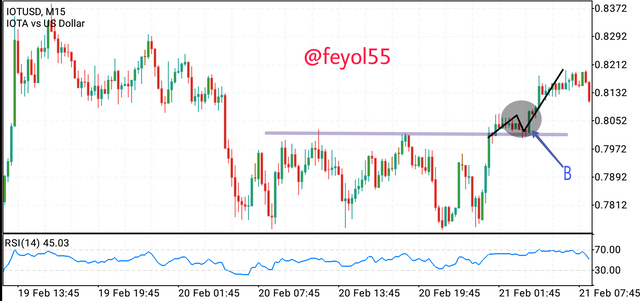
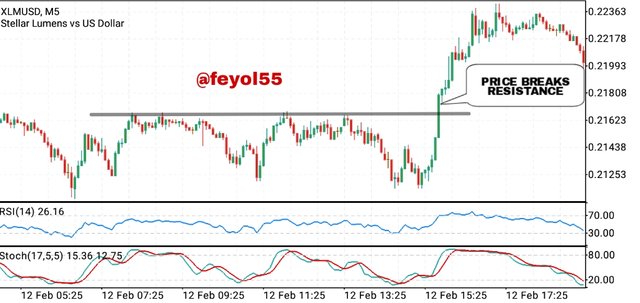
On the IOT/USD chart above, we can observe that price broke the resistance line but pulled back to its support before continue going uptrend. One can enter a BUY ENTRY at the point marked B as indicated on the chart. The stop loss can be placed below the resistance level and the take profit place at the next support level turned resistance. I also used the RSI indicator to filter and confirm my entry as we can see the RSI is indicating an overbought zone.
I'm going to be using two different charts to illustrate how to identify and explain the support breakout.
Let's look at the first image below.
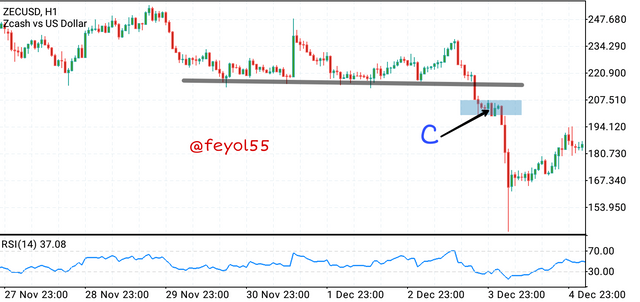
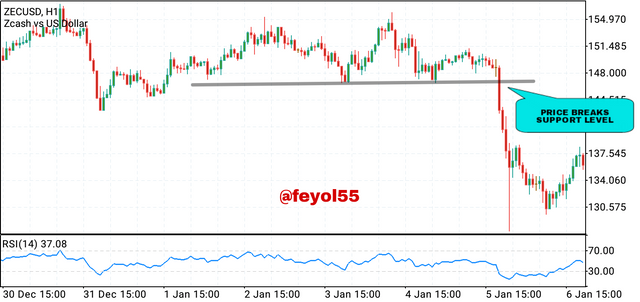
On this ZEC/USD chart above, we can observe that price gained momentum after a lot of selling pressure, price went down and broke the next support as indicated on the chart, after price broke this zone, it retraced back a little to gain more momentum and later went down forming a bearish trend. We can enter a SELL ENTRY at the point C on the chart and our stop loss can be placed above the broken support area, we can also set our take profit at the next resistance level turn support.
Similarly, I also used the RSI indicator as my filter, which helped to further confirm my SELL ENTRY as the RSI was at an oversold zone and it was selling at zone for sometime.
Let's look at the 2nd image below.
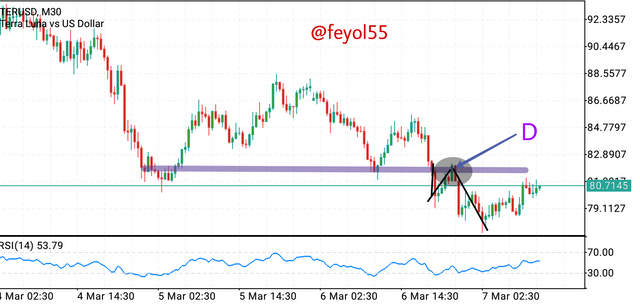
On this TER/USD above, I can observe that price broke the support line but retraced back to the resistance before continue going downtrend. One can enter a SELL TRADE at the point marked D as indicated on the chart. The stop loss can be placed above the broken support level and the take profit placed at the next resistance level turned support. I also used the RSI indicator to futher filter and confirm my entry as one can see the RSI is indicating an oversold zone.
Let's take a look at what a false breakout is
WHAT IS FASLE BREAKOUT ?
A false breakout usually happens at the key support and resistance zones, this scenario happens when price temporarily move below a major resistance level but this price will now later retrace back to the same point as it started. Some traders usually enter this deadly trap because most are quick to place their trade in the direction of the false breakout which will make them end up loosing big time.
Let's take a look at the chart below to further buttress the explanation.
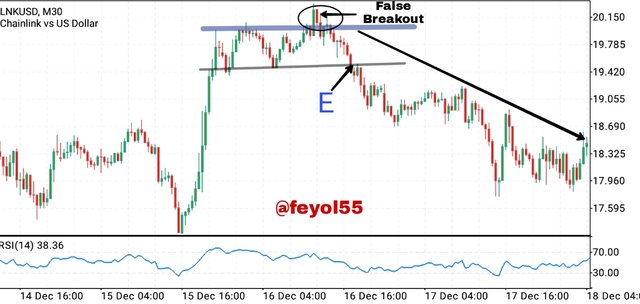
As you can see on the LNK/USD chart above precisely on the 30mins timeframe, the price breaks out of the resistance zone but this happens to be a false breakout and a deadly trap because as we can see immediately price retraced back to the resistance zone it went downward breaking the support (E). In this situation a trader should wait for price to return to the support turned resistance zone ensuring a bearish candlestick forms next before he can enter his trade.
Let's also take a look at the 2nd chart showing a false breakout at the support area.
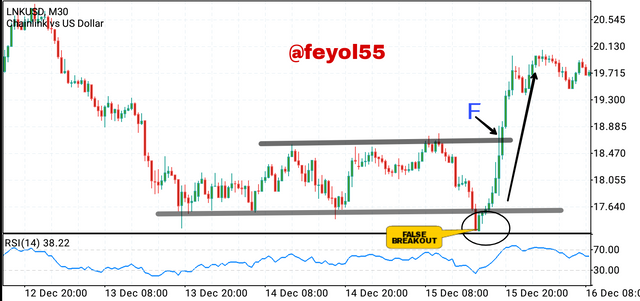
As we can see on the LNK/USD chart above, precisely on the 30mins timeframe, the price also breaks out of the support zone but this was apparently a false breakout, because as we can see price retraced back immediately to the support zone and went upward breaking the resistance (F). In this situation, a trader should wait for price to return to the resistance turned support zone and ensures a bullish candlestick forms next before he enters his trade.
Now let's look at how we can avoid this false breakouts trap
When a breakout occurs at a major zone be it support or resistance, one must ensure that price returns to test this level if the volume is low, after price retraces and test this level, then we can place our trade.
However, it is to be noted that if the key zone is broken in a bullish or uptrend direction on low volume, then one can place a SELL ENTRY on the crypto pair on a bearish pullback but if the key zone is broken on bearish or downtrend on low volume, one can place a BUY ENTRY on the crypto pair after a Bullish pullback.
Also one needs to be patient when trading at key zones, when we notice that price breaks a key zone, one should wait and observe that the candle closes to confirm the breakout's strength.
A trader should also know that the key zone which are the support and resistance zones becomes stronger and more significant when this zones have been tested multiple times over an extended period of time, understanding this Will help the trader avoid false breakouts.
Also, a trader can use good indicator like the RSI, MACD, Moving Average and Volume indicator to ascertain this key zones and filter out the false signals.
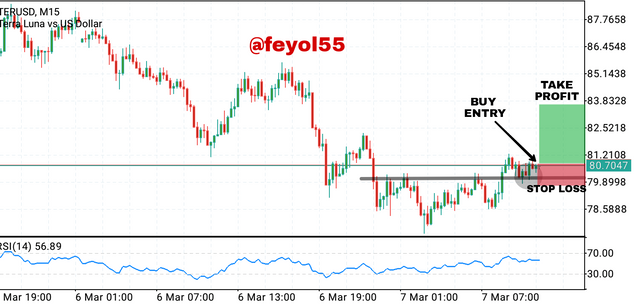
As seen on the TER/USD chart above, I carried out my analysis on the 15mins timeframe after I observed that a key resistance zone was broken by a strong bullish candle. After breaking this zone, I notice price retraced back again and I quickly entered a BUY ENTRY from that point. I set my step loss below the resistance level now turned support and my take profit at the next resistance point in a risk to reward ratio of 1:2.
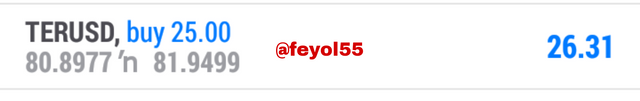
After some hours, I checked my trade and I saw I was in profit meaning the trade went in my direction as analysed. In conclusion, I made a total profit of $26 trading the resistance breakout on demo account.
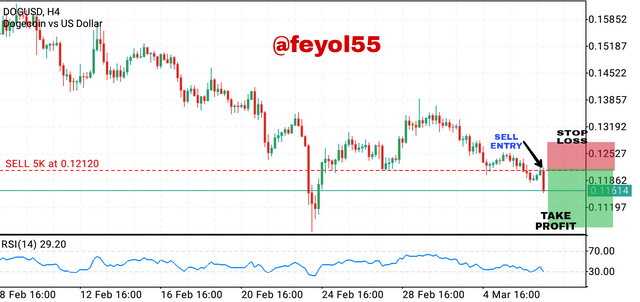
As seen on the DOG/USD chart above, I carried out my analysis on the 30mins timeframe after I observed that a key support zone was broken by a bearish candle. After breaking this zone, I noticed price retraced back again to this zone and I quickly entered a SELL ENTRY from that point. I set my stop loss above the support level now turned resistance and my take profit at the next support profit in a risk to reward ratio of 1:2
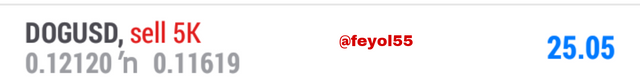
After some hours, I checked my trade and I saw I was in profit meaning the trade went in my direction as analysed. In conclusion I made a total profit of $25 trading the support breakout on my demo account.
This topic is a very eye-opening one to all traders because most people fall for this false breakouts traps while trading. I have been able to fully understand the concept behind trading the support and resistance breakouts as discussed in this study. These two key zones are necessary and sancrosant for every traders to know and understand because, from there one can predict the next price movement or trend. Also to filter out this false breakouts there are some conditions that must be observed which have been discussed extensively in this post as well.
Special thanks to professor @pelon53 for this wonderful course.