STRATEGY AND USE OF DONCHIAN CHANNELS | CRYPTO ACADEMY | S5W1 | HOMEWORK POST FOR @lenonmc21
Good Day steemians, I will be posting my assignment on the topic Strategy and use of Donchian channels as taught by professor @lenonmc21
.jpg)
DESIGNED ON POSTERMYWALL.COM
EXPLAIN AND DEFINE IN YOUR OWN WORDS WHAT THE DONCHIAN CHANNELS ARE ?
EXPLAIN IN DETAIL HOW DONCHIAN CHANNELS ARE CALCULATED (WITHOUT COPYING AND PASTING FROM THE INTERNET)
EXPLAIN THE DIFFERENT TYPES OF USES AND INTERPRETATION OF DONCHIAN CHANNELS (WITH EXAMPLES OF BULLISH AND BEARISH TRADES)
PRACTICAL
- MAKE 1 INNING USING THE 'DOCHIAN CHANNEL BREAKOUT STRATEGY' AND MAKE 1 INNING USING THE 'REVERSAL AND RETRACEMENT STRATEGY'. YOU MUST EXPLAIN THE STEP BY STEP OF HOW YOU ANALYSED TO TAKE YOUR ENTRY AND MAKE THEM INTO A DEMO ACCT SO THAT I CAN EVALUATE HOW THE OPERATION WAS TAKEN.

As we all know that traders who specialize in using technical analysis to pick their trades do so with the aid of trading indicators. The Donchian channels is another special type of indicator that can help a trader to pick good entry point on the trading chart. It is to be noted that this indicator was developed by a man known as 'Richard Donchian', this man was popularly known as the 'father of trend'. The Donchian channels primarily is used in detecting volatility, breakouts, trend reversal, overbought and oversold levels on the trading charts. The Donchian channels is made up of basically 'three' bands which are the upper band, middle band and lower bands.
Each of these bands are set using a specific 'period' and they all show the current market momentum. This period is set at a default setting of '20-period'. However, one can choose to change his/her settings depending on the chosen time frame (or the current market situation). If the price crosses the upper band, it means the market may go bullish, therefore the trader can place a 'BUY' position but if the price crosses the 'Lower band', it means the market may go bearish, So therefore, the trader can opt to place a 'SELL' position, but if the prices are swingling along the middle band, it means the market volatility at that point in time is low, so therefore, the trader can choose to wait pending when the price will cross any of the upper or lower band.
.png)
Image Source
The image above depicts how a typical Donchian channel indicator looks like on the trading chart.
The Donchian channel is basically calculated using a 'n period'. The 'n' is a set period that can stand for any figure depending on individual traders although the indicator has a default setting of '20 period' which implies a 20-day trading period within a month. However, one can set his own period base on covered time frame, like it could be 1 hour, 30 mins, 50 days, 3 weeks or 2 months.
To get the upper band period, I am going to look for the highest price of the crypto pair I want to trade in the last 5 trading days.
Also, to get the Lower band period, I am going to look for the lowest price of the crypto pair I want to trade in the last 5 days.
And to get the middle line band, I will subtract the lower band period from the upper band period.
Mathematically, this can be represented as :
Upper Band (UB) - nPeriod (Highest price in 5 days)
Lower band (LB) - nPeriod (Lowest price in 5 trading days)
Middle Band (MB) : Upper Band - Lower band divided by 2 [ I.e MB = UB - LB/2].
(Note : I perosnally chose to use 5 trading days which is my time measurement, there is no fixed time, so this value is subject to individual trader descretion).
The Donchian channel can be used and interpreted on the trading chart using the following factors :
- Volatility
- Overbought and oversold
- Strong Trends key Zone breakout.
VOLATILITY
Volatility can be interpreted on the trading chart using the Donchian channels. This indicator can be used to detect when a market is either calm or volatile. Hence, it will afford the trader to make better judgment of the market. As seen in the screenshot below, the period band becomes wider when the market is highly volatile and they come closer when the market is calm, this is an indication of a Low volatility.

SCREENSHOT TAKEN FROM Tradingview.binary.com
OVERBOUGHT AND OVERSOLD
In this scenerio, we can use the Donchian channel to interprete the market price as being overbought or oversold. When the upper band touches the price, it could be an indication that the market is oversold. The trader can choose to take advantage of this trends on the chart. The screenshots below shows a graphical explanation of the overbought and oversold region.


STRONG TRENDS AND KEY ZONE BREAKOUT
In this scenerio, the Donchian channel indicator can be used to pick out breakouts on the chart, when a price crosses or breaksout of the upper trend, this could be a strong indication to place a 'BUY TRADE' as the trends are generally strong at this points. An example of this market scenario can be seen in the screenshot below.

The screenshot shows a Bullish trend for ETH/USD pair on the 24HR time frame.
This same scenario is obtainable for breakouts in the Lower band. When the price crosses or breaksout of the Lower band, then the trader should be prepared to place a 'SELL' trade. An illustration of this can be seen in the screenshot below.

(YOU MUST EXPLAIN THE STEP BY STEP OF HOW YOU ANALYZED TO TAKE YOUR ENTRY AND MAKE THEM INTO A DEMO ACCOUNT SO THAT I CAN EVALUATE HOW THE OPEARTION WAS TAKEN)
One unique thing about the Donchian channel indicator is that it can be used to easily detect a breakout or a reversal in the market price. But in this case, we will focus more on the breakout strategy. This strategy can be employed when price break out of a particular trading range, when this occurs, we could possibly expect a Bullish or Bearish trade. The pic below illustrate that a breakout occurred in the market chart with the price shooting below the lower band.
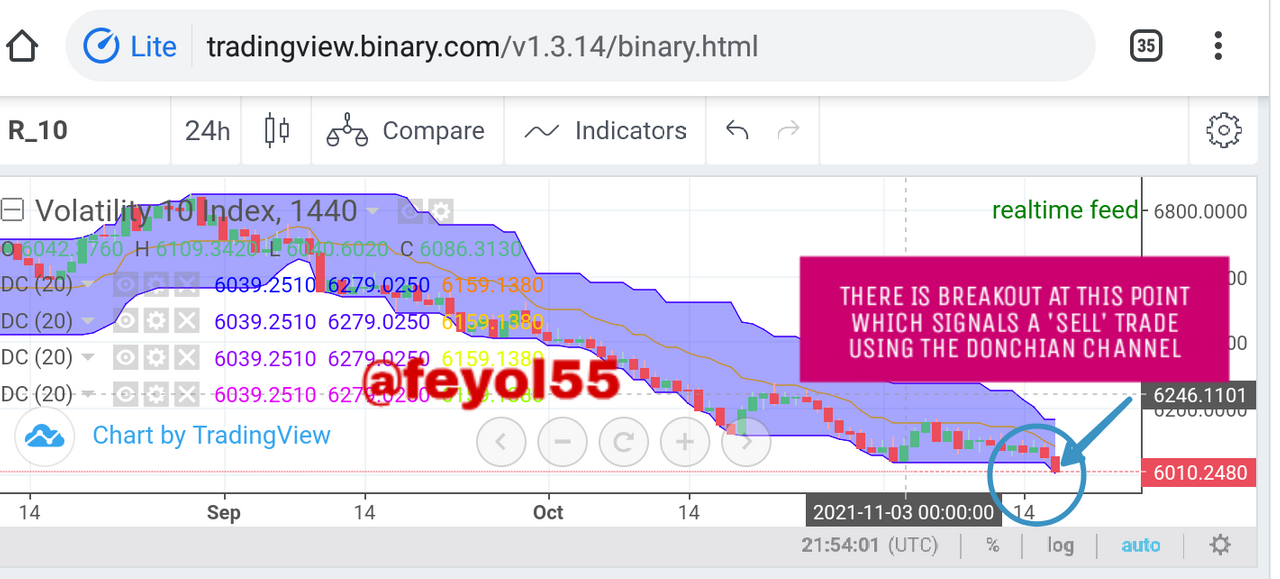
Screenshot Image Source
Looking at this pic, I was able to note and pick the breakout and I quickly placed a 'SELL' trade on Binary.com (demo acct) which I won, check the screenshot below for details.

Screenshot Image Source
The Donchian channel indicator can be used to detect a reversal or retracement. Looking at the screenshot below, I used this indicator to spot a retracement on the 'volatility 10' trading chart, immediately the price crossed the middle band, a reversal was expected looking at the general price trend which is also a bearish trade.

Screenshot Image Source
After checking this, immediately I went to my binary.com demo acct to place a 'SELL' and I won the trade.
Check the screenshot below for details

Screenshot Image Source
The Donchian channel indicator is a very powerful indicator tool that can help trader especially those who deals with technical analysis to make good trade with precisions. This course has enabled me to understand the effectiveness and usage of this tool properly and I will ensure I build more on what have learnt here. Special thanks to my professor @lenonmc21 for doing a great job.
Cc : @steemcurator01
@steemcurator02
@sapwood
@lenonmc21
Pls my amiable professors this post will soon expire in less than 3 days and it has not been voted