CANDLESTICK PATTERN | STEEMIT CRYPTO ACADEMY SEASON 4 | HOMEWORK POST FOR TASK 10
Good Day Everyone, trust we are all doing pretty good today, I want to submit my homework for task 10 given by professor @reminiscence01.
.jpg)
[Image Designed on PosterMyWall]
1A. EXPLAIN THE JAPANESE CANDLESTICK CHART? (ORIGINAL SCREENSHOT REQUIRED)
B. IN YOUR OWN WORDS, EXPLAIN WHY THE JAPANESE CANDLESTICK CHART IS THE MOST USED IN THE FINANCIAL MARKET.
C. DESCRIBE A BULLISH AND A BEARISH CANDLE. ALSO, EXPLAIN ITS ANATOMY.

1A. EXPLAIN THE JAPANESE CANDLESTICK CHART ? (ORIGINAL SCREENSHOT REQUIRED)
[ORIGINAL SCREENSHOT TAKEN FROM MT5 APP]
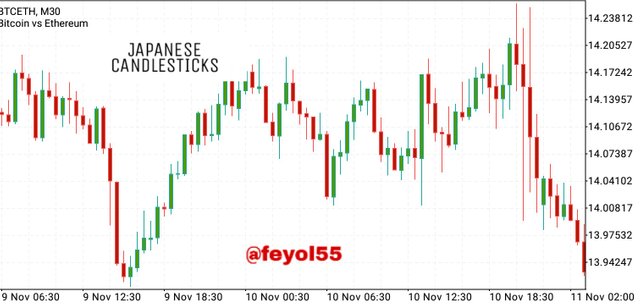
The Japanese candle stick is a popular name amongst every Forex, stock and crypto traders. This candlestick is specifically used by traders to trade the financial market. The person who developed this idea is a Japanese rice trader known as Munehisa Homma. He came up with the concept of using candle stick to predict market trend, the candlestick captures the market movements through graphical display of the price movements using two coloured (Red and Green) candles with different shapes or patterns. It is this pattern that traders who specialize in using technical analysis use to analyze the market trends and they come up with a production. Examples of the candlestick patterns include : Doji, Bearish Engulfing pattern, Bullish Engulfing pattern, Hammer, spinning top, inverted hammer, hanging man, stooting star, moving star, Harami engulfing etc. We still have some couple of others but these are the popular ones being used.
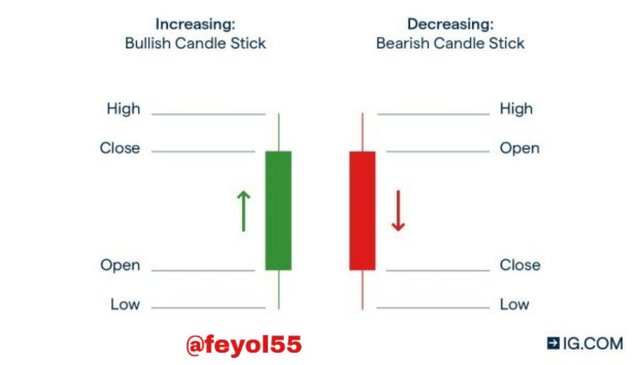
Image Source
Looking at the screenshot above, we can observe that the candlestick consist of High, Close, Open and Low points on each of the Bullish and Bearish candlestick respectively. I will briefly talk about what each of them means in the course of this assignment.
The Japanese candlestick over time has remained the most used trading tool by Stock, Forex and crypto traders. The reason behind this will be discussed subsequently.
NOTE
The Japanese candle stick can be used to analyze the market movement on any time frame. Moreover, If the time frame is set for 30mins, it will take 30mins for one single candle to be formed, and if the time frame is set for 15mins, it will take 15 mins for one candle to be formed, same scenario is applicable in every other time frame.
B. IN YOUR OWN WORDS, EXPLAIN WHY THE JAPANESE CANDLESTICK CHART IS THE MOST USED IN THE FINANCIAL MARKET.
Overtime, the use of the Japanese candlestick has become more prominent and popular among many financial market traders. This is as a result of many factors which I will be discussing below.
- ACCURACY AND DETAILS
When it comes to accuracy and details, the Japanese candlestick has that, the candlestick gives detailed graphics about the current market trend and happenings in clear pictures and images on different time frame, hence as a result of this, traders get more accurate results.
- POINTS/ELEMENTS OF TRADE
The Japanese candlestick consist of points or elements of trades such as High, close, Open and low. Using this graphical elements, traders can make better Judgements on the market charts. It also provides the trader with more information with which they can use to predict the market trend.
- EASY TO UNDERSTAND
The Japanese candle stick are easy to understand given that they are attractive to use because of the use of customerable colors and the simplicity of the candlestick.
- INDICATORS
Indicators are powerful trading tools and softwares that can be used along side with the Japanese candle stick to make a better trading decisions and identify good market patterns real quick by the traders.
- MARKET PSYCHOLOGY
With the use of the Japanese candle stick, sometimes at a glance, the traders can easily tell who is in control of a market, this is also known as market sentiment or trading psychology. The different candle stick pattern like the shooting star helps in quick decision making of the analysis.
- INTERACTION
This is another importance of the Japanese candlestick, it helps to show the interaction between the forces of demand and supply in the market, and also between the buyers and sellers.
All The listed reasons above are what makes most traders love and use the Japanese candlestick.
C. DESCRIBE A BULLISH AND A BEARISH CANDLE. ALSO EXPLAIN ITS ANATOMY (ORIGINAL SCREENSHOT REQUIRED)
The Japanese candlestick is basically in two forms which is the Bullish candle and the Bearish candle. I will be discussing them one after the other including their anatomy.
BULLISH CANDLESTICK
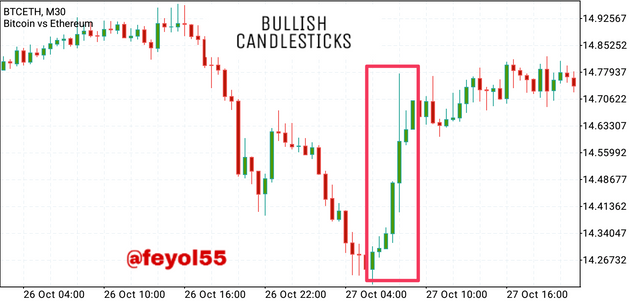
[ORIGINAL SCREENSHOT TAKEN FROM MT5 APP]
The picture above depicts a series of bullish candles forming a Bullish trend on the 30M time frame.
The Bullish candle is used to represent an upward trend in the market or inform the traders that the bulls/buyers are taking over the present market condition and are stronger than the sellers. Not only that the bullish candle normally increases or pushes up the price of the trading commodity. Most times, we can see the bullish candle at the bottom of a downward trend.
BEARISH CANDLESTICK
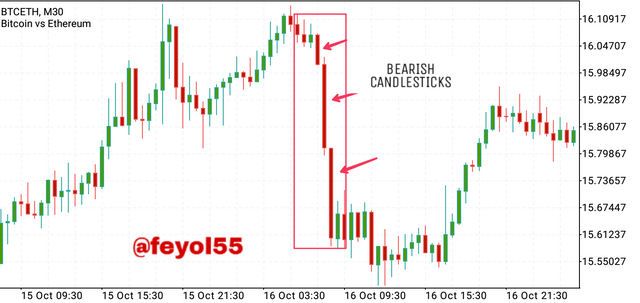
[ORIGINAL SCREENSHOT TAKEN FROM MT5 APP]
From the pic above, the candles in the red colour signifies the bearish candle. It is used to represent a downward trend on the market chart or it informs the traders that the the bears (sellers) are about to take over or change the present market situation. Once the market goes bearish or goes on a bear run, the prices of the asset or commodity trading at that point in time will automatically falls or decreases. The bearish candle can be seen at the top of an upward trend.
ANATOMY OF THE BULLISH CANDLESTICK
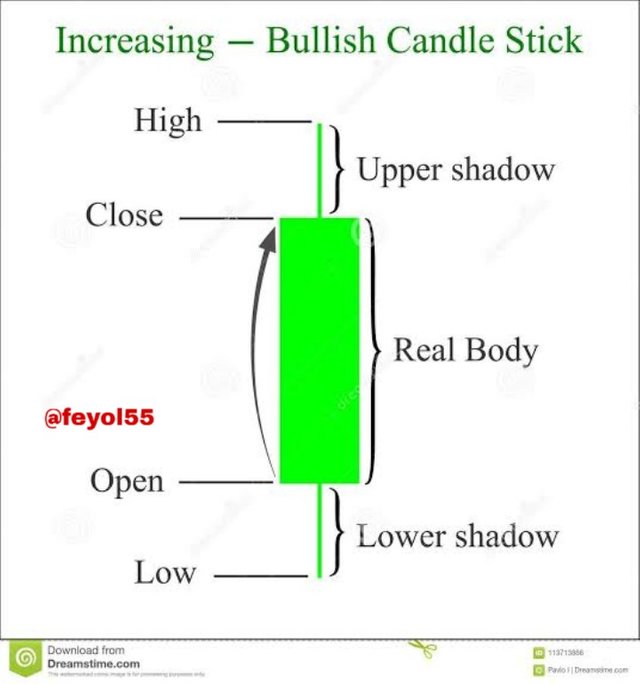
Image Source
From the pic above, we can pick four(4) main elements in the body of the candlestick . They are : High and Close (upper shadow), Low and Open (lower shadow). I will be discussing each of them briefly below
OPEN: This can also be referred to as the 'opening price'. As the name implies, this signifies the point at which the market price open for the day. For a Bullish candle, the opening price can be found at bottom or lower part of the candle.
CLOSE: This is also known as the closing price, when the upper part of a candlestick shows the closing price, it is a signal and indication that the bulls/buyer are in firm control of the market situation or price. For a Bullish candle, it is to be noted that the prices normally close above the opening price.
HIGH: This part of the candlestick signifies the highest point and price a particular asset has ever gotten to within a particular time frame.
LOW: This part of the candlestick also signifies the lowest price the asset has ever gotten to within a particular period of time.
ANATOMY OF THE BEARISH CANDLESTICK
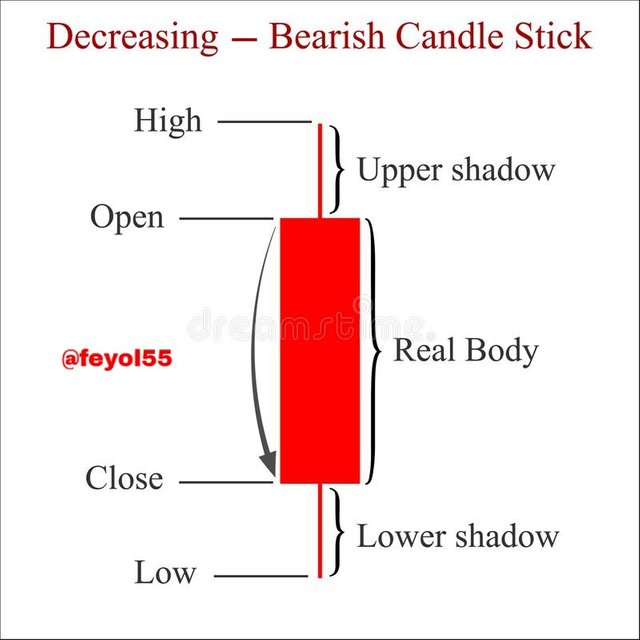
Image Source
Looking at the bearish candle image above, we can also pick four major elements which are High and Open (Upper shadow), Low and Close (Lower shadow), the anatomy of the bearish candlestick is a bit different from the bullish candlestick base on the upper and lower shadow structure. I will be discussing the four elements briefly below.
OPEN: It is also known as the opening price, this connotes the opening of price movement within a period of time. For a bearish candle, the opening price can be found at the top of the candle.
CLOSE : Also known as the closing price, for a bearish candle, the closing price is always at the bottom of the candle stick and the closing price normally falls below the opening price for a bearish candle.
HIGH : It signifies the highest point a particular asset has reached within a time frame.
LOW : It also signifies the lowest part a particular asset has reached within a period of time.
NOTE
There are some exceptional cases whereby some candles will appear to have no wick either on the upper shadow or lower shadow. The candle stick having no upper shadow is normally referred to as 'shaven head' while the candlestick with no lower shadow is normally referred to as 'shaven bottom'. This can be seen in the picture below.
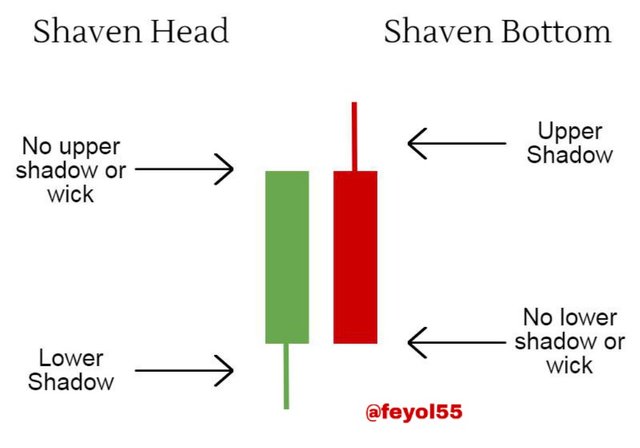
Image Source
CONCLUSION
The Japanese candlestick is an important trading tool for the financial market traders. It's importance cannot be overemphasized as it has really transformed the technique of trading. However this course has enable me to personally know more about the candlesticks and I will definitely continue to do more research about them and know how to effectively apply them so as to get good result.
Big thanks to professor @reminiscence01 for a job welldone on this course. Can't wait to learn more from you in the coming season. Special thanks also goes to other professors @sapwood @dilchamo @nane15 who has been tremendously awesome all through the course of the season, I sincerely appreciate you all !
Thank you for the wonderful review professor @dilchamo
Pls can you re-check my #club5050 status, I am a member and my powered ups within the last 30 days has been more than my my transfers as seen in the screenshot below
This screenshot from steemworld.org shows that have only transferred out 84 STEEM within the last 30 days (one month)
This second screenshot shows I have powered up a total of 105 STEEM within the last 30 days (one month)
Since 105 is greater than 84, this means that I have powered up more than I have transferred out.
Pls professor @dilchamo, i will appreciate if you can help re-check this again, thanks.
#club5050 😀