Understanding Trends II - Crypto Academy / S5W3- Homework Post for @reminiscence01".
(a) Explain your Understanding of Trend Reversal. What is the benefit of identifying reversal patterns in the Market? (b) How can a fake reversal signal be avoided in the market? (Screenshot needed).
TREND REVERSAL
Trend Reversal can simply be defined as the change in the directionof movement of the trend until the trend line is broken. It is an action of the price that that indicates the weakness of either buying or selling activities in the market of a cryptocurrency asset. Trend reversal happens when the price moves in the opposite direction, which is usually different from the direction it was moving until either the support or resistance level has been broken.
In the market of every cryptocurrency, buyers push the price up, making the asset to be in an uptrend (or a bullish run). At the point some of the persons sell off their assets, the price begins to go down. Along the line, some buyers come into the market and push the price up, making the price to have series of higher highs and lower highs. As more people sell off their position, the price goes down the more, below the previous lowest high when the trendline or market is broken. For a bullish trend, the previous lowest high is still within the trendline (support level) so once it is broken, the trend had reversed.
Also in the market of a cryptocurrency asset sellers push the price down, making the price to be in a downtrend. Along the line, the price reverse as a result of few buyers coming in but bounces back, making the price form series of lower lows and higher lows, still in a downtrend. A resistance level for the price is formed, preventing it from going up. As more people enter the market the market, with time, the resistance level (trendline or market) is broken. That is the previous higher low and the price begins to go up, once this happens, a trend reversal in an uptrend has taken place.
Benefits of identitying reversal
patterns.
It is important for every trader to be able to spot when a trend is likely to reverse as this does more good to a trader. The benefits of identitying a trend reversal patterns are listed below.
The identitification of trend reversal patterns helps to know when to take profit and also stop loss.
In trendline reversal pattern, when an asset is in a uptrend and the trend line is broken, it's time to take profit and leave the market. If paradventure one misses the period when the trendline was broken, one can wait to see if the lowest high (the ground support) would be broken. If this happens, a stop-loss should be made.It helps a trader to know when to enter the market. That is to make a buy entry. This is usually when the resistance (the bearish trendline) has been broken.
It helps to avoid unnecessary pressure to either enter or leave the market when the trend is still continuous.
Identifying the trend reversal patterns helps to avoid taking trades in good places as the price moves up and down.
It helps to avoid losing part of once profit by selling late and also avoid entering the market too early in a rush,thereby having to wait for days to come out of a long bearish market.
How to Avoid Fake Reversal Signals
No reversal signals from reversal patterns or technical indicators is 100% accurate at all times. To avoid fake reversal signals, it is necessary to combine reversal patterns to be able to spot or confirm a reversal signal from a single pattern. Because of the volatility of cryptocurrencies, anything can happen and since these patterns are better than one another, it is good to confirm their signals with others.
Also, fake reversal signals can be avoided by combining one or two reversal pattern with the indicators. Indicators read the future prices of cryptocurrencies with the information from the past, so they can better tell what the price will do than this patterns. Therefore in order to avoid taking decisions that one would regret, it is best to combine indicators
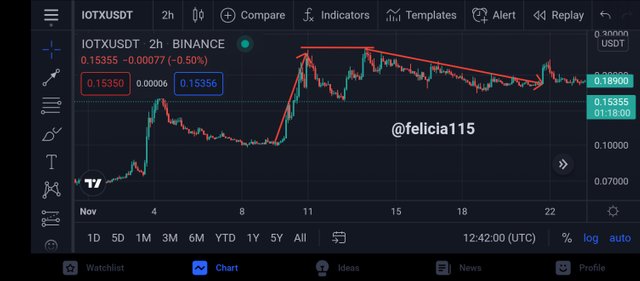
If you check the screenshot presented above, the asset was in a bullish trend until the trend line was broken. The asset didn't reverse for long because after few hours, the uptrend continued. The indicator confirms the fake signal from the trendline reversal pattern. Buyers pushed the price up for the uptrend to continue.
Give a detailed explanation on the following Trend reversal identification and back up your explanation using the original chart. Do this for both bullish and bearish trends (Screenshots required). (a) Break of market structure. (b) Break of Trendline. (c) Divergence (d) Double top and Double bottom
BREAK OF MARKET STRUCTURE
The prices of cryptocurrency do not just go on one direction when in either an uptrend or a downtrend. Even as the trend continues, there are times when the price pull back as a results of the activities of buyers and sellers. As this happens, a structure is formed for bullish and bearish market. This wis what is called the market structure. Once this structure is broken for the trends, one can say that the trend has reversed.
A bullish market structure is therefore a structure formed as the price of an asset goes up with some pull backs. It is made up of higher highs and lower highs. The lower highs are in an ascending manner. Once the price comes below the recent lower high, the structure has been broken.
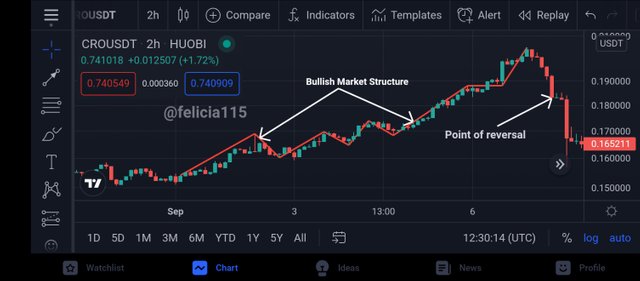
A bearish market structure is a structure formed as the price of an asset goes down with some pull backs. It is made up of lower lows and higher lows. The higher lows here are in a descending manner. Once the price goes above the recent higher low, the structure has been broken.
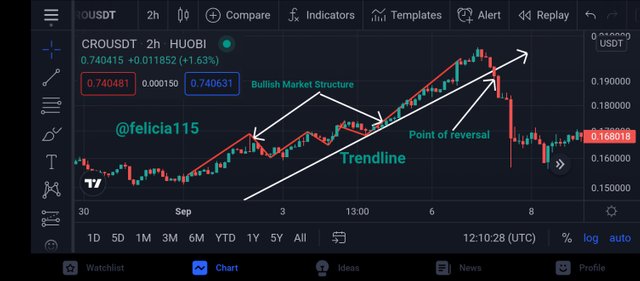
TRENDLINE
The trendline is a line that follows a particular trend. It is the point where the price bounces back when there is a pool back. The price cannot go below the line because the trend continues but once it happens, the trend has changes.
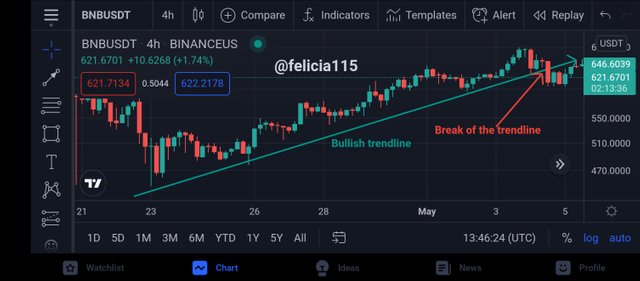
A bullish trendline serves as a support preventing the price from going doing as buyers come into the market. It is drawn at at the base of the candlesticks. Once this support line is broken, the asset has changed direction to go in a downtrend
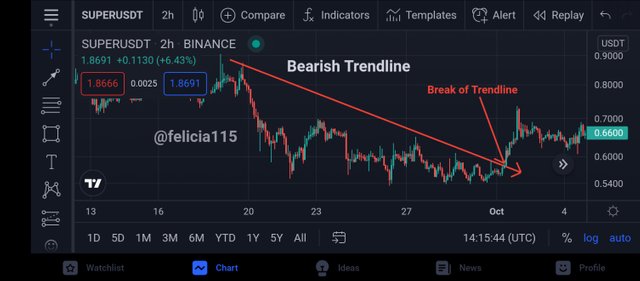
A bearish trendline serves as a resistance preventing the price from going up as more persons sell once the price goes up and close to the line. It is drawn at the top of the candlesticks. Once this resistance line is broken, the asset had changed direction to go in an uptrend.
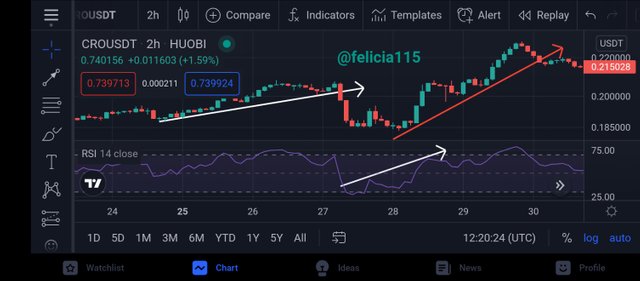
DIVERGENCE
Divergence in the chart of cryptocurrencies occurs with the action of the price and the indicator. When the moves from the indicator becomes different from the moves of the price on the chart, divergence is set to occur.
This tells one that the price is about to reverse in its initial direction. There are bullish and bearish divergence.
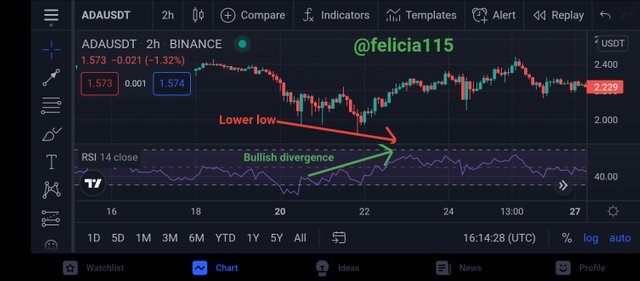
A bullish divergence occurs when the price makes lower lows on the chat simultaneously with the indicator making higher lows. This is to tell us the asset is about to go in an uptrend.
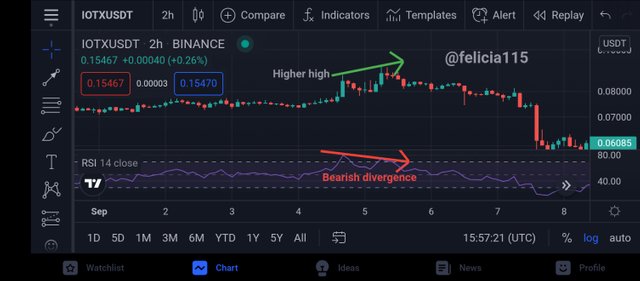
A bearish divergence occurs when the price makes higher highs on the chat simultaneously with the indicator making lower highs. This is to tell us that the asset is about to reverse in a downtrend.
DOUBLE TOP AND DOUBLE BOTTOM
In a trending market, a double top is formed when the price is going up. In this formation, the price makes a high move and then falls to almost the recent support level and then goes up again to the highest point it reached hours or minutes ago.
The criteria for double top to occur are that, the price must first reach a high point that has not been reached in recent times. Then after pulling back for a while, it must return to that highest point reached but must not go above it.
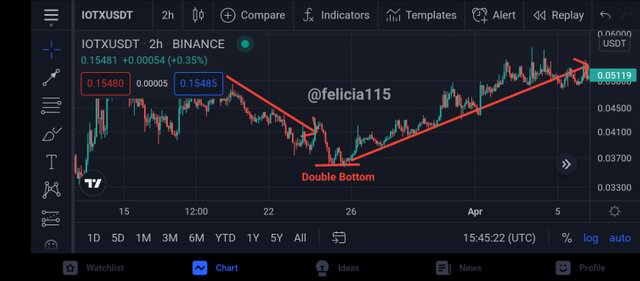
A double bottom is formed when the price is going down. In this formation, the price moves down to a very low point, lower than all the previous lows and then pulls back, after a while, it goes down again to the lowest point it recently reached.
The criteria for a double top cenario to a occur in charts is that, the price must first move to a very low point it had not reached in recent times. Then it should have a pull back in an uptrend for a while then drop again to that point but must not go below it.
Double top and double bottom are trend reversal patterns that can help a trader enter and leave the market at appropriate time in other to maximize profits.
place a demo trade using any crypto trading platform and enter a buy or sell position using any of the above mentioned trend reversal/continuation pattern.
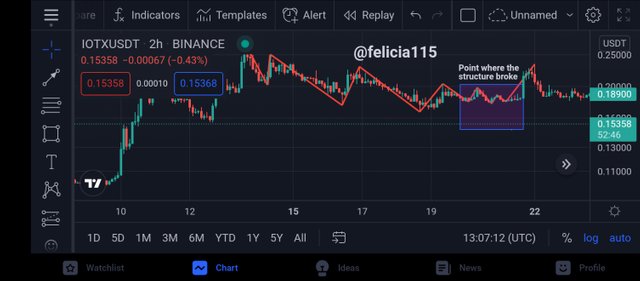
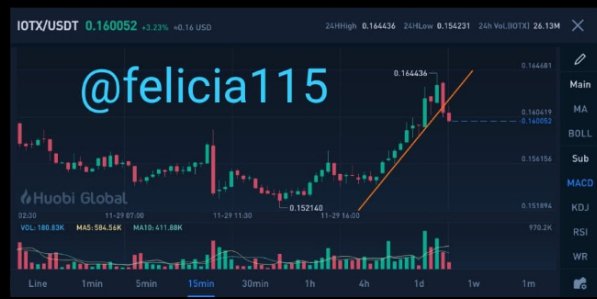
Instead of demo trade, I made a live trade by placing a sell order on IOTX/USDT pair using the trendline reversal pattern.
I exited the trade as soon as the price crossed the trendline. This screenshot shows the trendline which I used to analyze the market and took my sell order.
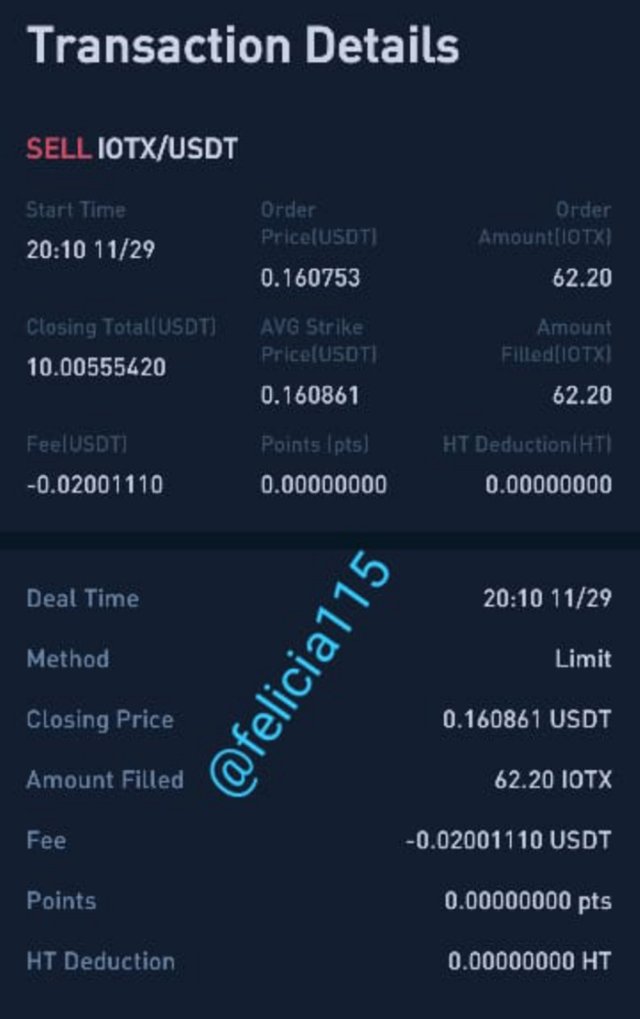
The details of my sell order on Huobi platform his also shown below.
CONCLUSION
All the trend reversal patterns discussed are very good reversal patterns that would help a trader take the best decision. However, we should know that they take some time to form and one has to be patient so trades are not done in a rush to avoid "had I known". They should be combined with indicators to confirm their authenticity because false signals are presented by them some times.
All the images I used are images I prepared myself using tradingview. Only the last two were taken from Huobi exchange. Images explained each section where their application was necessary.