Trading Using Rectangle Pattern - Crypto Academy / S5W4 - Homework Post for @sachin08".
Here is my submission.
Explain Rectangle Pattern in your own word.
The rectangle pattern is formed when the price an asset stops going in its original direction and starts traveling sideways. The sideways movement occurs when an the asset continues to range in price visible on chart for several hours or minutes forming series short bullish and bearish candles in a rectangle fashion.
The rectangle pattern can be formed at any point of the market in the movement price. When ever it is formed, no one really know the direction it would go after a breakout occurs. It can either continue in its original trend or change direction. The important thing is that a trader should wait until the bring out occurs to be able know the best decision to take.
In the rectangle pattern, a upper horizontal flat line of resistance is formed and a lower horizontal flat line of support is formed. The price ranges between the space in these line until the breakout happens. It should be noted that the rectangle pattern is not formed until there are either three to three or two to two touches of the candles on the lines. These touches are the closing prices of the assets in the time frame set on the chart which are minor highs and minor lows.
How to identify Rectangles. Explain with Screenshots.
To identify rectangle pattern in a chart, the first thing we need to note is that that rectangle pattern comes after a trend (uptrend or downtrend). When rectangle pattern forms in a chart, we would see that the price just ended a trend briefly or slowed down from moving in a particular direction and moves sideways. In this pattern, we see the price bouncing between support and resistance levels severally. The pattern scatters only when there is a genuine breakout.
To confirm that this pattern has been formed successfully, the bouncing off from the support and resistance level should be repeated two to three times.
A rectangle pattern for instance in an uptrend will hit a resistance at some point and begin to fall. In falling it means a support and goes back up to find a resistance (not necessarily in the initial resistance level) then goes down again to the support and which pushed it up again and so on.
One other thing to note in the identification of rectangles is that they come at the end of a trend which serves as a start for the new trend. This means that bullish rectangles forms at the start of the uptrend but are an end for bearish trend. Also, bearish rectangles froms at the start of a downtrend but ends a bullish trend.
See examples below:
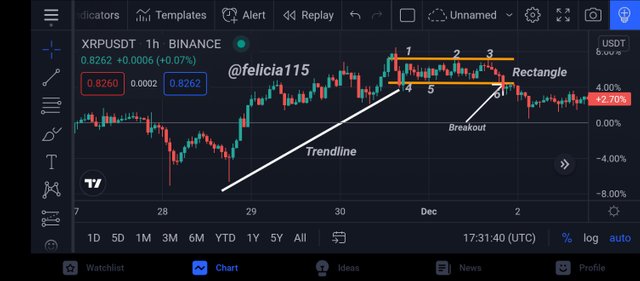
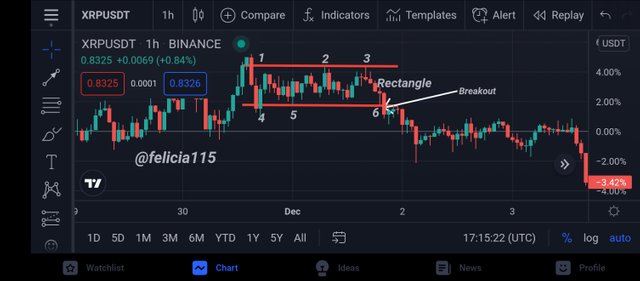
Rectangle fromed at the end of an uptrend but is a beginning for downtrend
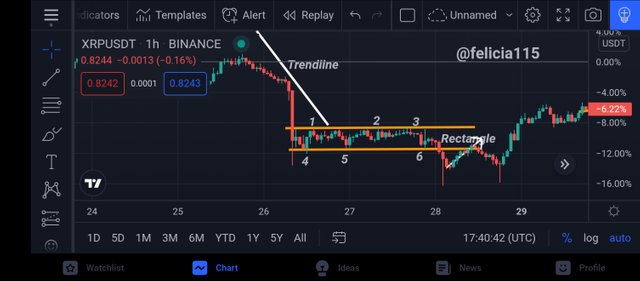
Rectangle fromed at the end of an downtrend but is a beginning for uptrend
Can we use indicators with this pattern to get accurate results? Explain with Screenshots.
Rectangle patterns are used to know trade entry points for buy and sell entries in trades. Because of the volatility of cryptocurrency assets, rectangle patterns can generate force signals therefore it is of utmost importance that the breakout points of the pattern is confirmed with other patterns oor technical indicators to be sure of their authenticity.
As no trading pattern, strategy or technical indicators achievethe best result all by itself, it is important that the rectangle pattern is combined with the use of indicators. This is done in order to confirm signals and flush out false signals.
As the rectangular pattern is a trend following pattern. That is, it's breakout results in a trend, it would be best to use either momentum indicators or trend following indicators in conjunction with the pattern.
Trend following indicator like parabolic sar and momentum indicator like stochastic oscillator or relative strength index can be helpful in the confirmation of breakouts and identification of false signals associated with the rectangle patterns.
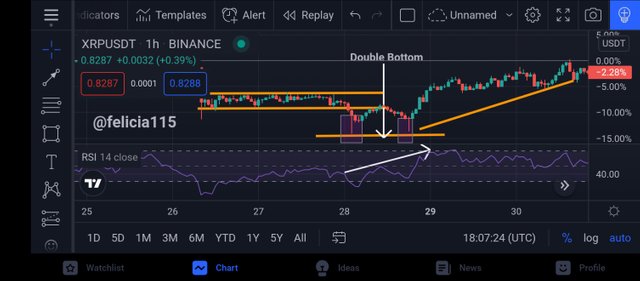
In the chart of XRP/USDT above, we can see that immediately after the rectangle had formed, the price made a double bottom. And it is known that after the price makes a double bottom, the price changes direction.
The RSI indicator also diverged forming higher highs as the rectangle formed. This is an indication that the signal from the rectangle pattern is true and trading decision can be made with it.
Explain Rectangle Tops and Rectangle Bottoms in your own words with Screenshots of both patterns.
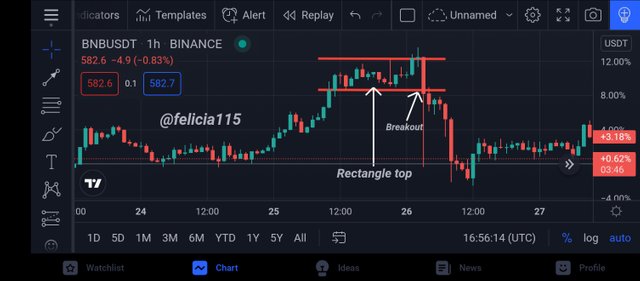
Rectangle top is simply a rectangle fromed in a uptrend when price tops moving in the upward direction and starts moving sideways. Rectangle tops starts forming when the price has returned from a pull back but cannot continue in the uptrend and starts moving sideways. Most of the time, rectangle tops is characterised by a breakout in an uptrend (that is a continuation of the previous trend.
They are found to be seen at the top of the trend.
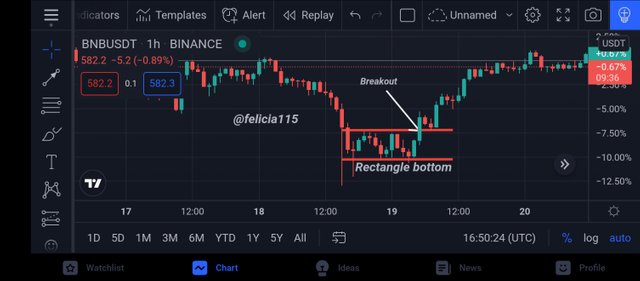
Rectangle bottoms are fromed at either beginning of an uptrend or at the middle or end of a downtrend. When an asset wants to move up, it can form a rectangle with candle moving between support and resistance before finally breaking out to the upside. In doing this, a rectangular bottom can be formed.
Similarly, it can be formed at the middle of a downtrend before continuing in the downside. It can mark the end of a downtrend and the start of an uptrend.
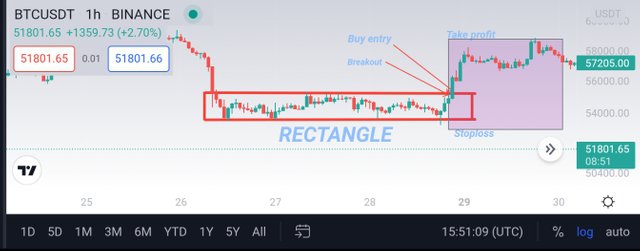
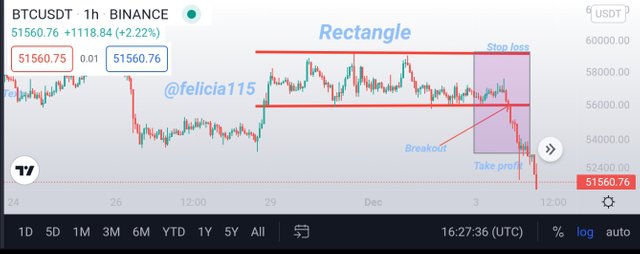
Show full trade setup using this pattern for both trends. ( Entry Point, Take Profit, Stop Loss, Breakout)
Buy trade Setup
Sell Trade Setup
Conclusion
Last Friday, I made an buy entry of three assets when they were in a rectangle pattern thinking that after the sharp fall, the trend is weak that why their price s move sideways. This sideway movement continued until the next morning when the price further fell.
Today I have learnt that a sharp fall in the price of an asset that leads to a sideways movement does not guarantee that the trend has stopped. If the price moves sideways in a downtrend, buyers can influence it upward movement but if sellers stop loss, the price further goes down. This applies also to an uptrend scenario where the price can go down after ranging for sometime if people take profit otherwise, the price can go up if more buying take place at that level it ranges.
@sachin08 please grade my work. It's 5 days already.
I mistakenly clicked edit instead of reply. Please grade my work so it would be curated before the due date.