Simple Trading Pattens - Crypto Academy / S5W2 - Homework Post for @sachin08".

Hello Prof @sachin08. I present below the assignment in your course. I hope my knowledge of this course adds to the knowledge of crypto being built in the academy. Do have a great time going through my work.
What is your understanding about Triangles in Trading. Explain all forms of triangles in your own words. (Screenshot required)
TRIANGLE PATTERNS
A triangle pattern is formed when the price of an asset moves within a tiger range as time progresses making it easy to see the struggle between uptrend and downtrend.
The triangle pattern is seen as a continuation pattern in the sense that price goes in it's initial direction after the pattern has completely been formed. In general, a triangle pattern is considered to be in formation when the price touches both the resistance and support line five times. For instance, two touches of the price on the resistance line and three touches on the support line or the other way round.
The types of triangles are explained as follows.
SYMMETRICAL TRIANGLE
This is a type of triangle pattern that forms series lower highs and higher lows as it comes together at the highest candle. In this type of triangle, the resistance line descends while the support line ascends, having a narrow end near the highest point on the chart.
It therefore gives signal that the buyers refuses to enter the market to make the price go upward and the sellers refuse to sell off their positions capable of bringing the price down. This is a kind of indecisive state of the market. This pattern is not good for trade as a result of the less volatility of the market. It's best for a trader to wait for a breakout which give higher level of probability that has a better risk-reward ratio compared to price motion confined to the triangle.
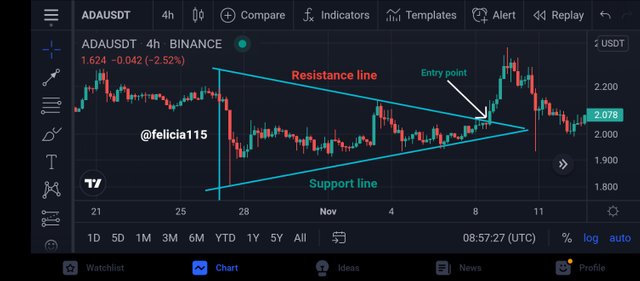
As shown in the screenshot above, the price is confined within the descending and ascending trendlines. In this case a breakout occurred in the upward direction which could have also occurred in the downward direction. Where the breakout occurred is the right place to enter the market and retest either the ltrendline by setting a stop loss at the highs or lows that have occurred before which is dependent on the direction the price is going.
ASCENDING TRIANGLE
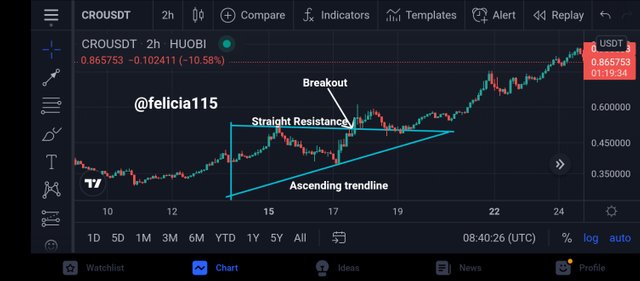
This type of triangle pattern is made up of an ascending support line and a straight resistance line which disallows price from breaking to the upward direction. In this situation, a series of lows and highs formed become higher and flat (in a straight line) respectively. This means that many traders are entering the market, many buy orders are executed and the price is pushed up. As the price is pushed up, there can still be a break at the downside as sellers may sell of their positions if they have made reasonable profit. A point of entry can either be at the ascending trendline or straight resistance line where a break and retest of any of the two lines.
DESCENDING TRIANGLE
This type of triangle pattern is where there is a descending resistance line and a straight trendline of support that disallows price from going down. In this pattern, the price at resistance level forms lower highs that are in a slope and the price at support level forms lows in a straight line. Here sellers have upper hand in pushing the price down.
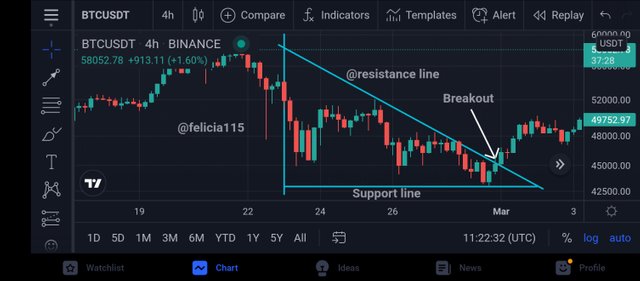
As shown in the image above, the price breaks the support and goes in a downtrend. In the case of a descending triangle pattern, there are higher chances that the price will break the support level. Even as this is so, it should be noted that a break can happen in either direction (downside or upside).
Can we also use some Indicators along with it Triangle Patterns? Explain with Screenshots.
The use of indicators in trading cannot be over emphasized in taking trading decisions. Aside indicators, trading strategies and patterns also gives good trading results. No indicator, strategy or pattern stands alone and gives the best trading results. To be able to trade effectively with triangles and make good profit, there is a need use some Indicators that follows or act like the patterns. The use of the triangle pattern is a trend following pattern which needs to be confirmed with trend following indicators. These indicators go in the direction of the trend. Example is parabolic sar. Parabolic sar is a trend indicator that forms dots above and below the price action to tell the direction of the price. It can be used alongside triangle patterns to know the direction of the price.
Also, momentum indicators like RSI and Stochastic Oscillator can be used to confirm the signals from triangle patterns as they they tell when the trend is very strong and when it becomes weak. By marking overbought and oversold points, they tell when a trend is about to change. Momentum indicators gives signals and confirm the ascending and descending triangle patterns, telling when they are valid and when they become weak. This indicator would tell when the breakout points in triangle patterns are valid and help set a good take profit and stop loss levels.
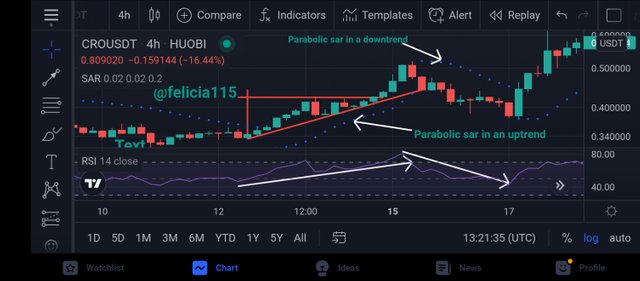
Presented above is an screenshot of an ascending triangle. On the chart is the parabolic sar indicator giving same signals as the triangle. Below the chart is the RSI (relative strength index giving same signals as the triangle and the parabolic sar indicator.
Explain Flags in Trading in your own words and provide screenshots of both Bull Flag and Bear Flag.
In the cryptocurrency markets, traders can identify the extension of trends by making use of of bullish and bearish continuation patterns which occur in shapes and patterns that can be easily identified. Just like the triangle patterns, the flag patterns also shows the continuation of a trend. We have the bull and bear flag patterns.
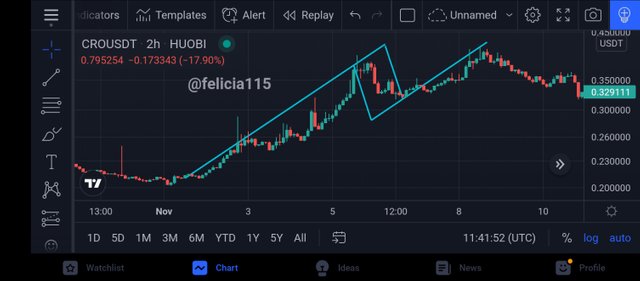
Screenshot of a Bull Flag from Tradingview
The bull flag is correctly identified in an uptrend when the price of an asset is likely to continue moving up. On the other hand, the bear flag is identified in a downtrend when the price of an asset is likely to continuously go down.
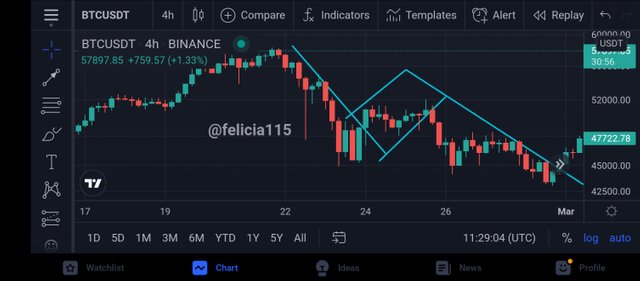
Screenshot of a Bear Flag from Tradingview
The flag patterns (bull and bear flags) is made up of two parts. These are the pole and the flag. The pole stands for strong increasing or decreasing movement of the prove in higher or lower direction while the flag stands for retracement or draw back which shows a channel going down or up depending on the pattern of the flag.
The flag pattern can be extremely beneficial to a trader since it provides obvious points of success and failure from which to benefit or limit risk. When resistance in a bull flag breaks, the trader can be assured that the price will continue to rise along the length of the pole.
Show a full trade setup using these Patterns on any Cryptocurrency chart. (Ascending Triangle, Symmetrical Triangle, Bear Flag)
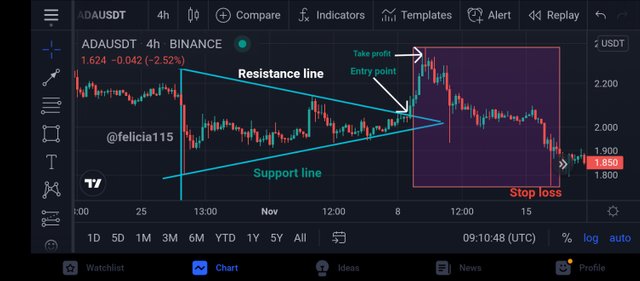
Trade Setup using Ascending Triangle
If you look closely at the screenshot I presented for ascending triangle setup, there is no place marked for buy entry (I actually forgot it to mark it). The buy entry point is the point slightly above the breakout point. One can enter the market from that point.
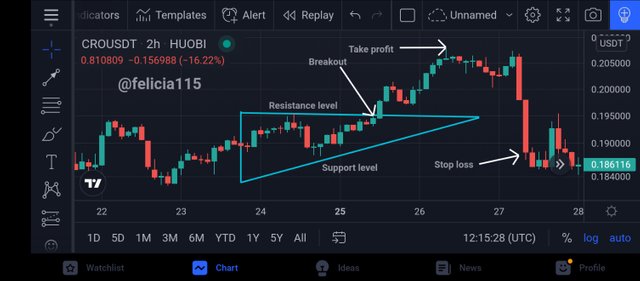
Trade setup using Symmetrical Triangle
Trade Setup using Bear Flag
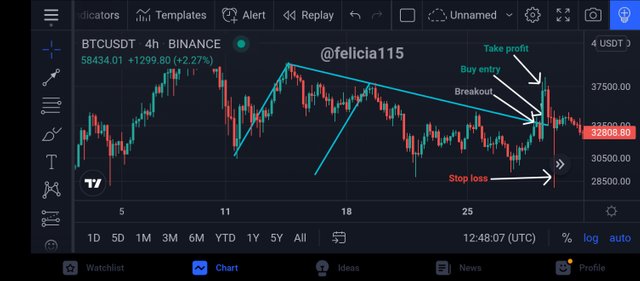
All the important points have been marked in all the set up for the patterns I was asked to provide. With this, one can take a full trade from the point of entry to the point of exit where one either take profit or stop loss.
Conclusion
I have come to the end of this knowledgeable but tasking course. I glad to have learnt about the use of triangles flags pattern in crypto trading. It is an addition to my archive of knowledge in crypto and it would be of a great use.
I only answered the questions in the way I understood them. I am open to corrections in order to improve on this pattern. Looking forward to your corrections, reviews and grading.
Cc:
@sachin08