Confluence Trading - Crypto Academy / S5W6- Homework Post for @reminiscence01
Question 1: Explain Confluence trading. Explain how a trade setup can be enhanced using confluence trading.
Confluence Trading is a trading method which has to do with the use of more than one strategy to trade or make trading decisions. This trading style involves confirming the signals from a strategy with another strategy. This can be use of multiple indicators or a combine use of an indicator with another strategy different from an indicator.
Confluence trading is used to establish that an agreement is established between one's preferred indicator or trading strategy and another reliable one to be sure of the next action of the price in order to take a position (buy or sell).
Confluence Trading is a common trading style among crypto and forex traders because most technical indicators do not have the same level of accuracy but they have close accuracy. If two or more indicators are saying almost same thing about the price of an asset at a time, it is a good signal to make a decision in the direction one wants.
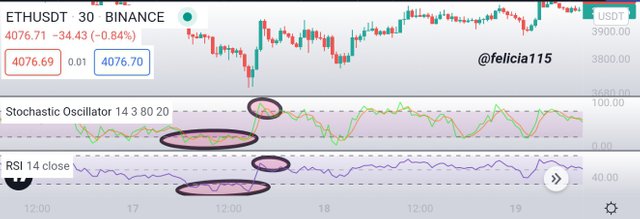
Using confluence trading, a trader can do a good trading set up. To do this, one has to combine leadings and lagging indicators. Leading indicators should be combined and lagging indicators should be combined. Leading indicators present their signals very quick while lagging bring indicators bring late signals.
For leading indicators, one can combine RSI and Stochastic oscillator and for lagging indicator, one can combine parabolic sar and moving average.
It is easier to confirm the signals from an indicator with a similar indicator than with another type of indicator.
See screenshot below for proper view.
Question 2: Explain the importance of confluence trading in the crypto market?
Confluence Trading is so important in the trading of cryptocurrency because of the lagging nature of indicators and other trading patterns. The use confluence trading cannot be over emphasized because the fact that using only one indicator can make one enter the market too early for either a buy or sell position.
Most technical indicators and Trading strategies do present false signals oweing to the importance confluence in trading cryptocurrency.
To be specific, some of the importance of confluence trading are:
It increases boldness and remove the the fear in trading. With the use of confluence trading, traders can trade with boldness because they have confirmed the intending directly of the the trend and trade without fear. Fear is something every trader has because of the volatile nature of cryptocurrency but with confluence, fear can be removed.
The use of two or more indicators or strategies in trading which establish confluence helps to confirm signals and identify false signals. False signals can make one enter the market at the wrong times and affect trading profits and make one wrong at loss. With confluence trading, false signals can easily be identified.
Cryptocurrency trading is a risk in its own because crypto can decide to go in any direction. Without the use of confluence in trading, it will be too much of a risk to trade cryptocurrency. The use of confluence therefore can help the risk involved in trading cryptocurrencies.
It helps to know or identify the perfect entry point for a buy or sell entry. With two or three indicators or three different strategies giving the same signal, a person can comfortably enter the market and make a reasonable profit.
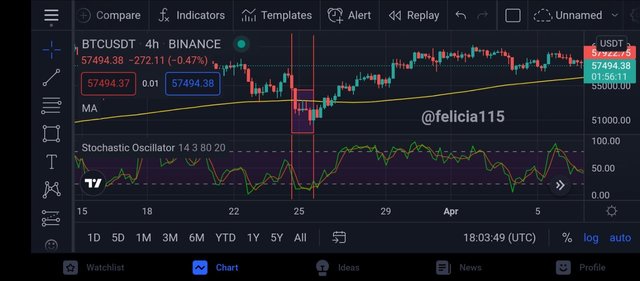
Question 3. Explain 2-level and 3-level confirmation confluence trading using any crypto chart.
2-Level Confirmation Confluence
This has to do with the confirmation of the the action of price with two technical indicators. The confirmation here can be done also with two different trading strategies or the combination of an indicator with another reliable strategy. In this method of confirmation, the two trading strategies must give same signal for the signal to be valid.
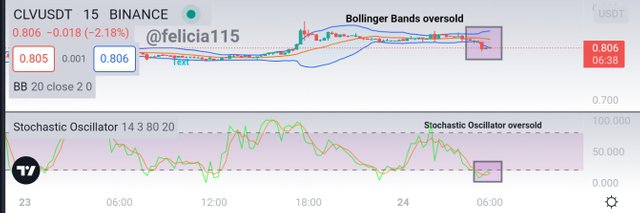
The following screenshot explains 2-Level confirmation confluence.
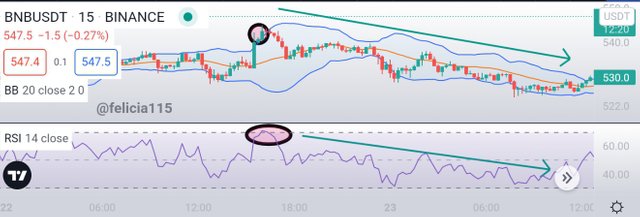
In the above screenshot, Bollinger Bands and RSI are used to establish confluence. From the screenshot, it can be seen that at the point Bollinger Bands was overbought, RSI was overbought. This is confluence. The two indicators confirmed the signals from each other.
3-Level Confirmation Confluence
3-Level confirmation confluence trading has to do with the use of three strategy to confirm the action of the price in the chart before making a decision. This can be the use of three different indicators, three different trading patterns or the combination of indicators and patterns. Whatever way they are combined they should be maximum of three to avoid confusion.
The perfect Entry Strategy is a very good example of 3- Level Confirmation Confluence. In this strategy, three conditions are to be fulfilled and once they happen, the asset is good for a buy or sell depending on its current trend.
Once a doji candlestick pattern or evening/morning star candlestick pattern appears in a trend and at the same time the 200 moving average comes close to the candle with the Stochastic oscillator overbought or oversold, a position to sell or buy can be taken respectively.
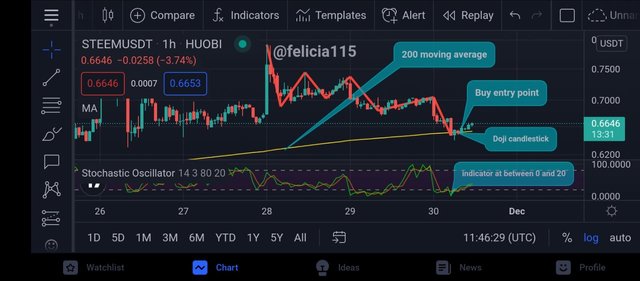
In the screenshot above, a 3-Level confirmation confluence trading or perfect-entry conditions were fulfilled to make a buy entry. If you look very well, the asset started going up immediately the confluence was established.
Question 4: Analyze and Open a demo trade on two crypto asset pairs using confluence trading. The following are expected in this question. (a) Identify the trend. (b) Explain the strategies/trading tools for your confluence. (c) What are the different signals observed on the chart?
To fully express my understanding of this trading strategy, I carried out a live trade after analyzing two assets (SUPER & CLV). SUPER was for a sell position while CLV was for a buy position.
The screenshots presented below are the analyses I made on [tradingview]tradingview.com) in order to buy and sell the CLV and SUPER coins respectively.
The trading tools for the confluence are Bollinger Bands and Stochastic Oscillator.
For the Bollinger Bands, it has three lines along which the price moves, upper band, middle band and lower band. The Bollinger Bands gives signal for when a trend is strong and weak. When it is strong, the price is either overbought (above the upper band) or oversold (below the lower band). When it is weak, the price is either between the upper band and middle band (majorly when it has returned from an overbough point)
or between the lower band and middle band (majorly when it has returned from an oversold point).
The Stochastic Oscillator is an indicator calibrated from 0 to 100.It signals overbought and oversold just like the Bollinger Bands. If you look closely you will see an area marked with dotted lines, one at the top, and the other at the bottom. The upper one is the 80 line that represents overbought while the lower one is the 20 line that represents oversold. So once the price goes above the 80 line, it is overbought and once it goes below 20 line, it is oversold.
At the point of making the entry to buy the CLV coin, it is clear that the asset was oversold according to the Bollinger Bands and Stochastic oscillator.
It is clear that the asset was in a downtrend.
The signals observed from both charts was thar the asset was oversold
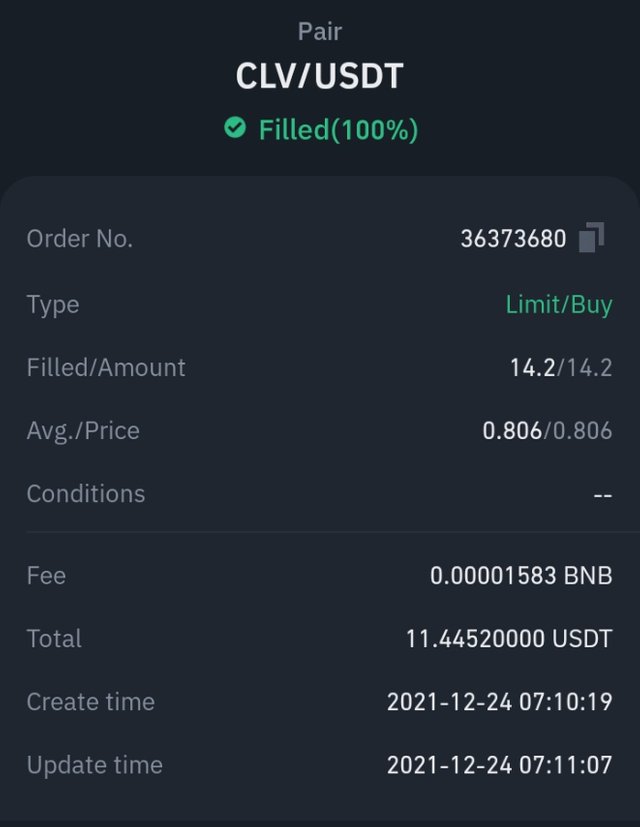
This is the screenshot for the buy trade from the analysis from the chart using the two indicators.
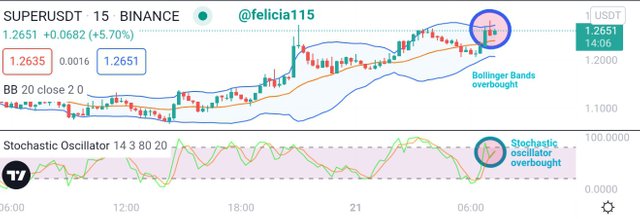
At the point of making the entry to buy the SUPER coin, it is clear that the asset was overbought according to the Bollinger Bands and Stochastic oscillator.
It is clear that the asset was in a uptrend.
The signals observed from both charts was that the asset was oversold
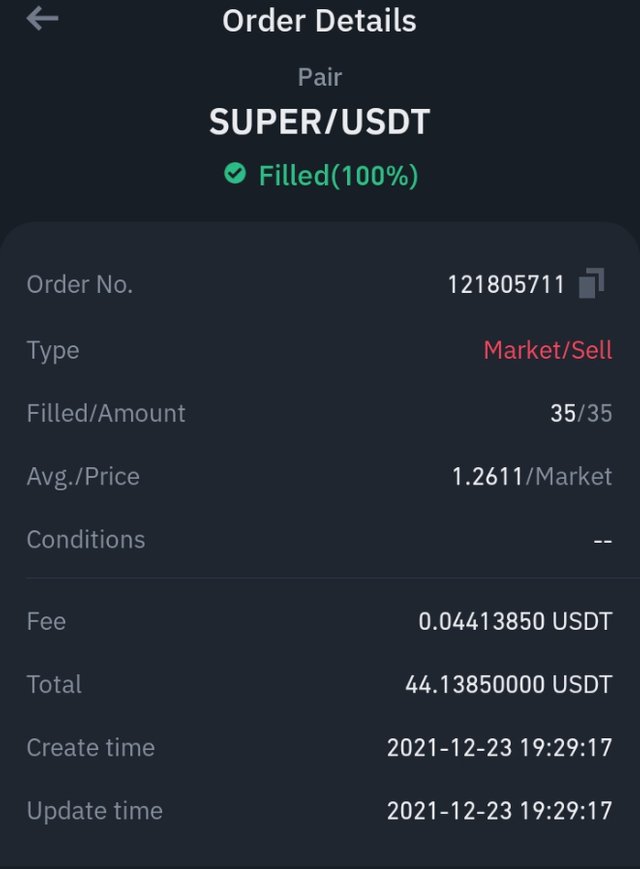
This the screenshot for the sell trade from the analysis that was made from the chart using the two indicators.
Conclusion
I am happy to comr to the end of this course with a complete write up on the given task.
I shall like my Prof to know that I did all the screenshot using tradingview. I am open to corrections as I know I am still a learner in cryptocurrency trading.
Cc: @reminiscence01
Hello @felicia115 , I’m glad you participated in the 6th week Season 5 of the Beginner’s class at the Steemit Crypto Academy. Your grades in this task are as follows:
Recommendation / Feedback:
Thank you for participating in this homework task.